Stellar Lumen (XLM) Price Could Gain Momentum If It Clears $0.12

Source Livebitcoinnews
  • Stellar lumen price is attempting a fresh increase from the $0.1020 zone against the US Dollar.
  • XLM price is now trading above $0.1100 and the 55 simple moving average (4 hours).
  • There was a break above a key bearish trend line with resistance at $0.1140 on the 4-hour chart (data feed via Kraken).
  • The pair could accelerate higher if there is a clear move above the $0.120 resistance zone.

Stellar lumen price is trading in a positive zone above $0.1100 against the US Dollar, like Bitcoin. XLM price must clear $0.1050 to gain bullish momentum.

Stellar Lumen Price Analysis (XLM to USD)

After forming a base above the $0.100 zone, Stellar lumen price started a decent increase against the US Dollar. The XLM/USD pair traded above the $0.1080 resistance to move into a positive zone.

There was a break above a key bearish trend line with resistance at $0.1100 on the 4-hour chart. The price cleared the 50% Fib retracement level of the downward move from the $0.1367 swing high to the $0.0915 low. XLM is now trading above $0.1100 and the 55 simple moving average (4 hours).

On the upside, the price is facing resistance near the $0.1195 zone. It is near the 61.8% Fib retracement level of the downward move from the $0.1367 swing high to the $0.0915 low. The next major resistance is near the $0.1200 level.

A clear move above the $0.1200 level might send the price toward the $0.1250 zone. Any more gains could lead the price toward the $0.1350 level or even $0.1380.

Initial support on the downside is near the $0.110 level. The main support is near the $0.1050 zone. Any more losses could lead the price toward the $0.1020 level in the near term, below which the price might even retest $0.100.

Stellar Lumen (XLM) Price

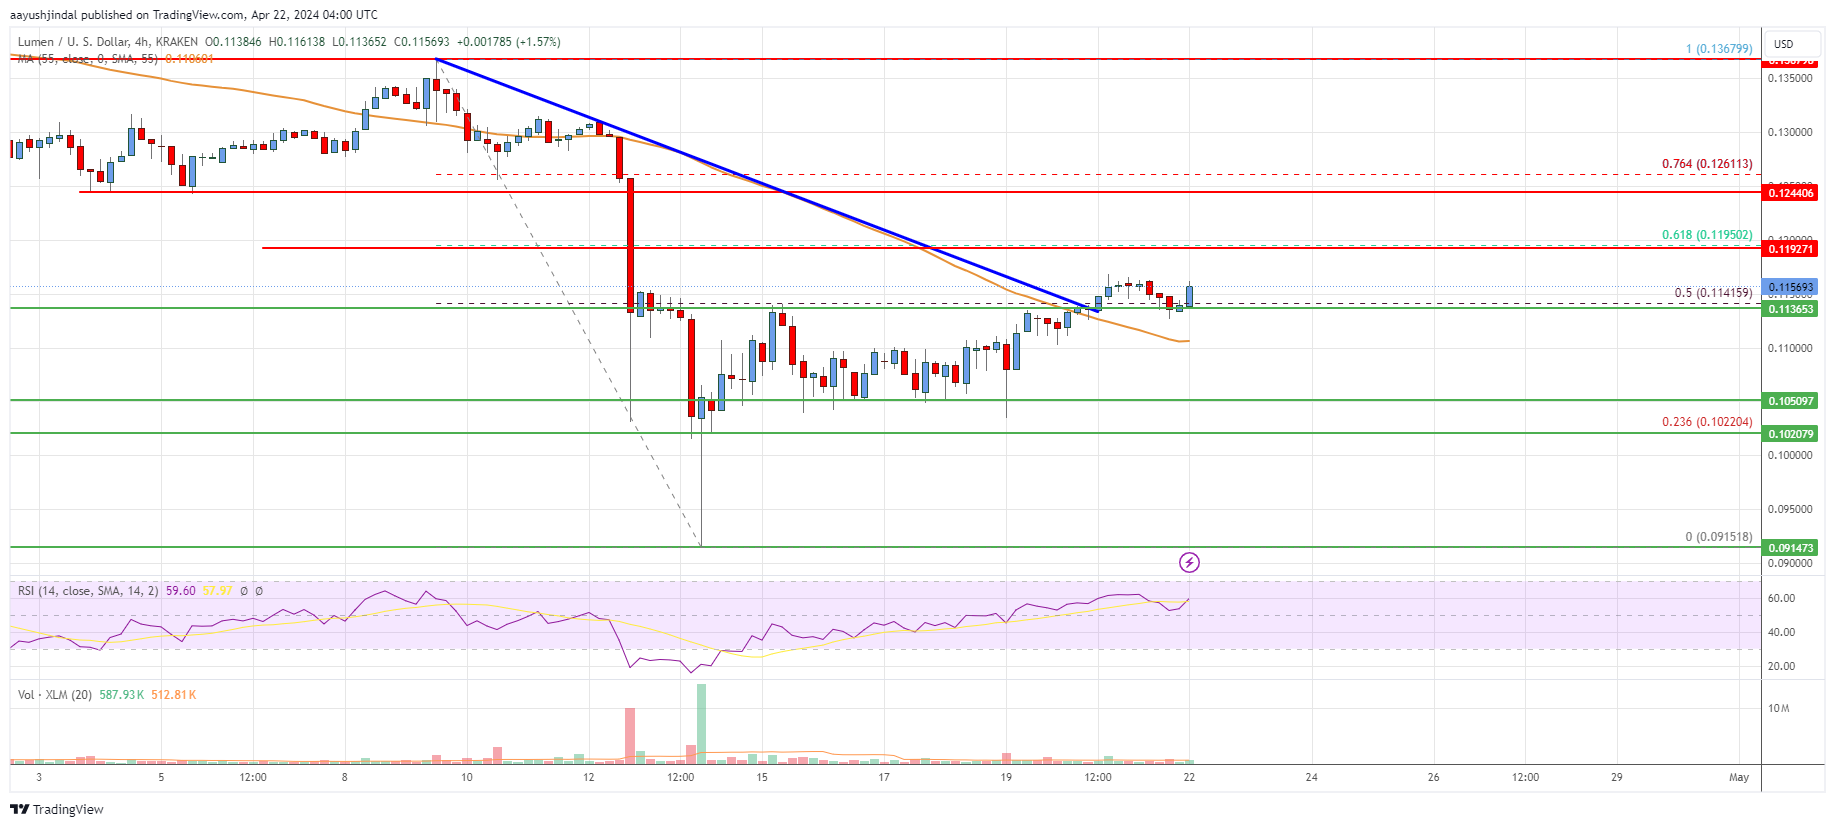
The chart indicates that XLM price is now trading above $0.110 and the 55 simple moving average (4 hours). Overall, the price could start a major increase if there is a clear move above the $0.120 resistance zone.

Technical Indicators

4 hours MACD – The MACD for XLM/USD is gaining momentum in the bullish zone.

4 hours RSI – The RSI for XLM/USD is now above the 50 level.

Key Support Levels – $0.1100 and $0.1050.

Key Resistance Levels – $0.1195, $0.1200, and $0.1250.

The post Stellar Lumen (XLM) Price Could Gain Momentum If It Clears $0.12 appeared first on Live Bitcoin News.

Disclaimer: For information purposes only. Past performance is not indicative of future results.
placeholder
The 2026 Fed Consensus Debate: Not Hassett, It’s About Whether Powell Stays or GoesKevin Hassett, White House National Economic Council Director, is poised to succeed Jerome Powell as the next Federal Reserve Chair. This development signals a potentially more dovish mon
Author  TradingKey
8 hours ago
Kevin Hassett, White House National Economic Council Director, is poised to succeed Jerome Powell as the next Federal Reserve Chair. This development signals a potentially more dovish mon
placeholder
Avalanche Bulls Eye Trend Reversal, Though Muted Derivatives Signal CautionAvalanche (AVAX) consolidates above $14.00 after an 8% breakout, but with open interest below $600 million and key resistance at $17.14 looming, traders remain cautious.
Author  Mitrade
11 hours ago
Avalanche (AVAX) consolidates above $14.00 after an 8% breakout, but with open interest below $600 million and key resistance at $17.14 looming, traders remain cautious.
placeholder
Bitcoin Bollinger Bands indicate another 'parabolic' bull signal like late 2023Historical patterns indicate that low BandWidth levels often precede significant BTC price increases.
Author  Mitrade
12 hours ago
Historical patterns indicate that low BandWidth levels often precede significant BTC price increases.
placeholder
AUD/USD sticks to gains above 0.6600, highest since late October after Aussie trade dataThe AUD/USD pair prolongs its strong uptrend witnessed over the past two weeks or so and advances to a fresh high since late October during the Asian session on Thursday.
Author  FXStreet
17 hours ago
The AUD/USD pair prolongs its strong uptrend witnessed over the past two weeks or so and advances to a fresh high since late October during the Asian session on Thursday.
placeholder
Solana Price Forecast: ETF Demand and Derivatives Flows Fuel a Sharper ReboundSolana (SOL) trades above $140 after a 10% daily jump, as ETF inflows flip positive, futures open interest climbs 6.75% and on-chain TVL and stablecoin liquidity rise, setting up a potential double-bottom breakout toward the 50-day EMA at $158 if SOL can secure a daily close above $145.
Author  Mitrade
Yesterday 06: 36
Solana (SOL) trades above $140 after a 10% daily jump, as ETF inflows flip positive, futures open interest climbs 6.75% and on-chain TVL and stablecoin liquidity rise, setting up a potential double-bottom breakout toward the 50-day EMA at $158 if SOL can secure a daily close above $145.
goTop
quote