


Enjin Coin provides high-reward, low-risk buy-the-dip opportunity
- Enjin Coin price has dropped more than 50% in the past month.
- With more than 55% of ENJ holders underwater, investors could consider buying the dip.
- The 7-day exchange flows suggest that investors are confident about the recovery rally.
Enjin Coin (ENJ) price has been on a downtrend since the 2021 peak and shows signs of slowing down. The more than 50% crash noted in the past four weeks suggests a potential buy-the-dip opportunity.
Also read: Enjin Coin Price Forecast: ENJ could trigger 20% correction if this key level fails
Enjin Coin price at a pivotal point
Enjin Coin price has shed nearly 95.80% from its all-time high (ATH) of $4.85 and formed a bottom at $0.203. In the past six months, however, ENJ showed massive strength that led to an exponential move of 151% between February 5 and March 4, which set up a local top at $0.698. This move breached the lower highs formed in the downtrend that spanned over the past 17 months, suggesting a short-term breakout rally.
However, due to the worsening market conditions, the Enjin Coin price completely wiped out the 151% gains in the next four weeks as it dropped more than 55%. Currently, ENJ sits atop the declining trend line connecting the swing highs formed since August 15, 2022.
The Relative Strength Index (RSI) has slipped below the 50 mean level, suggesting a potential flip of the momentum favoring bears. However, due to the extended nature of the recent correction, a retracement seems plausible, which could offset the RSI’s bearish outlook. The Awesome Oscillator (AO) shows a weak but bullish favor as it hovers above the 0 mean level.
Considering the 151% move that breached a 17-month downtrend, a further upside move has a high probability, especially if the general market outlook improves. So, patient investors looking to buy the dip have a good opportunity to do so. However, accumulation of ENJ at the current level of $0.341 should be done with a few considerations.
If the outlook for Enjin price is bullish,
- A flip of the $0.386 support level is something that investors need to watch out for.
- Beyond this short-term hurdle, ENJ also needs to overcome $0.486 and, finally, $0.698.
Flipping the $0.698 resistance level into a support floor will open the path for Enjin coin price to kickstart a massive uptrend and tag the $1 psychological level. This move would constitute a nearly 200% gain from the current level of $0.341.
Also read: Bitcoin Price Outlook: All eyes on BTC as CNN calls halving the ‘World Cup for Bitcoin’
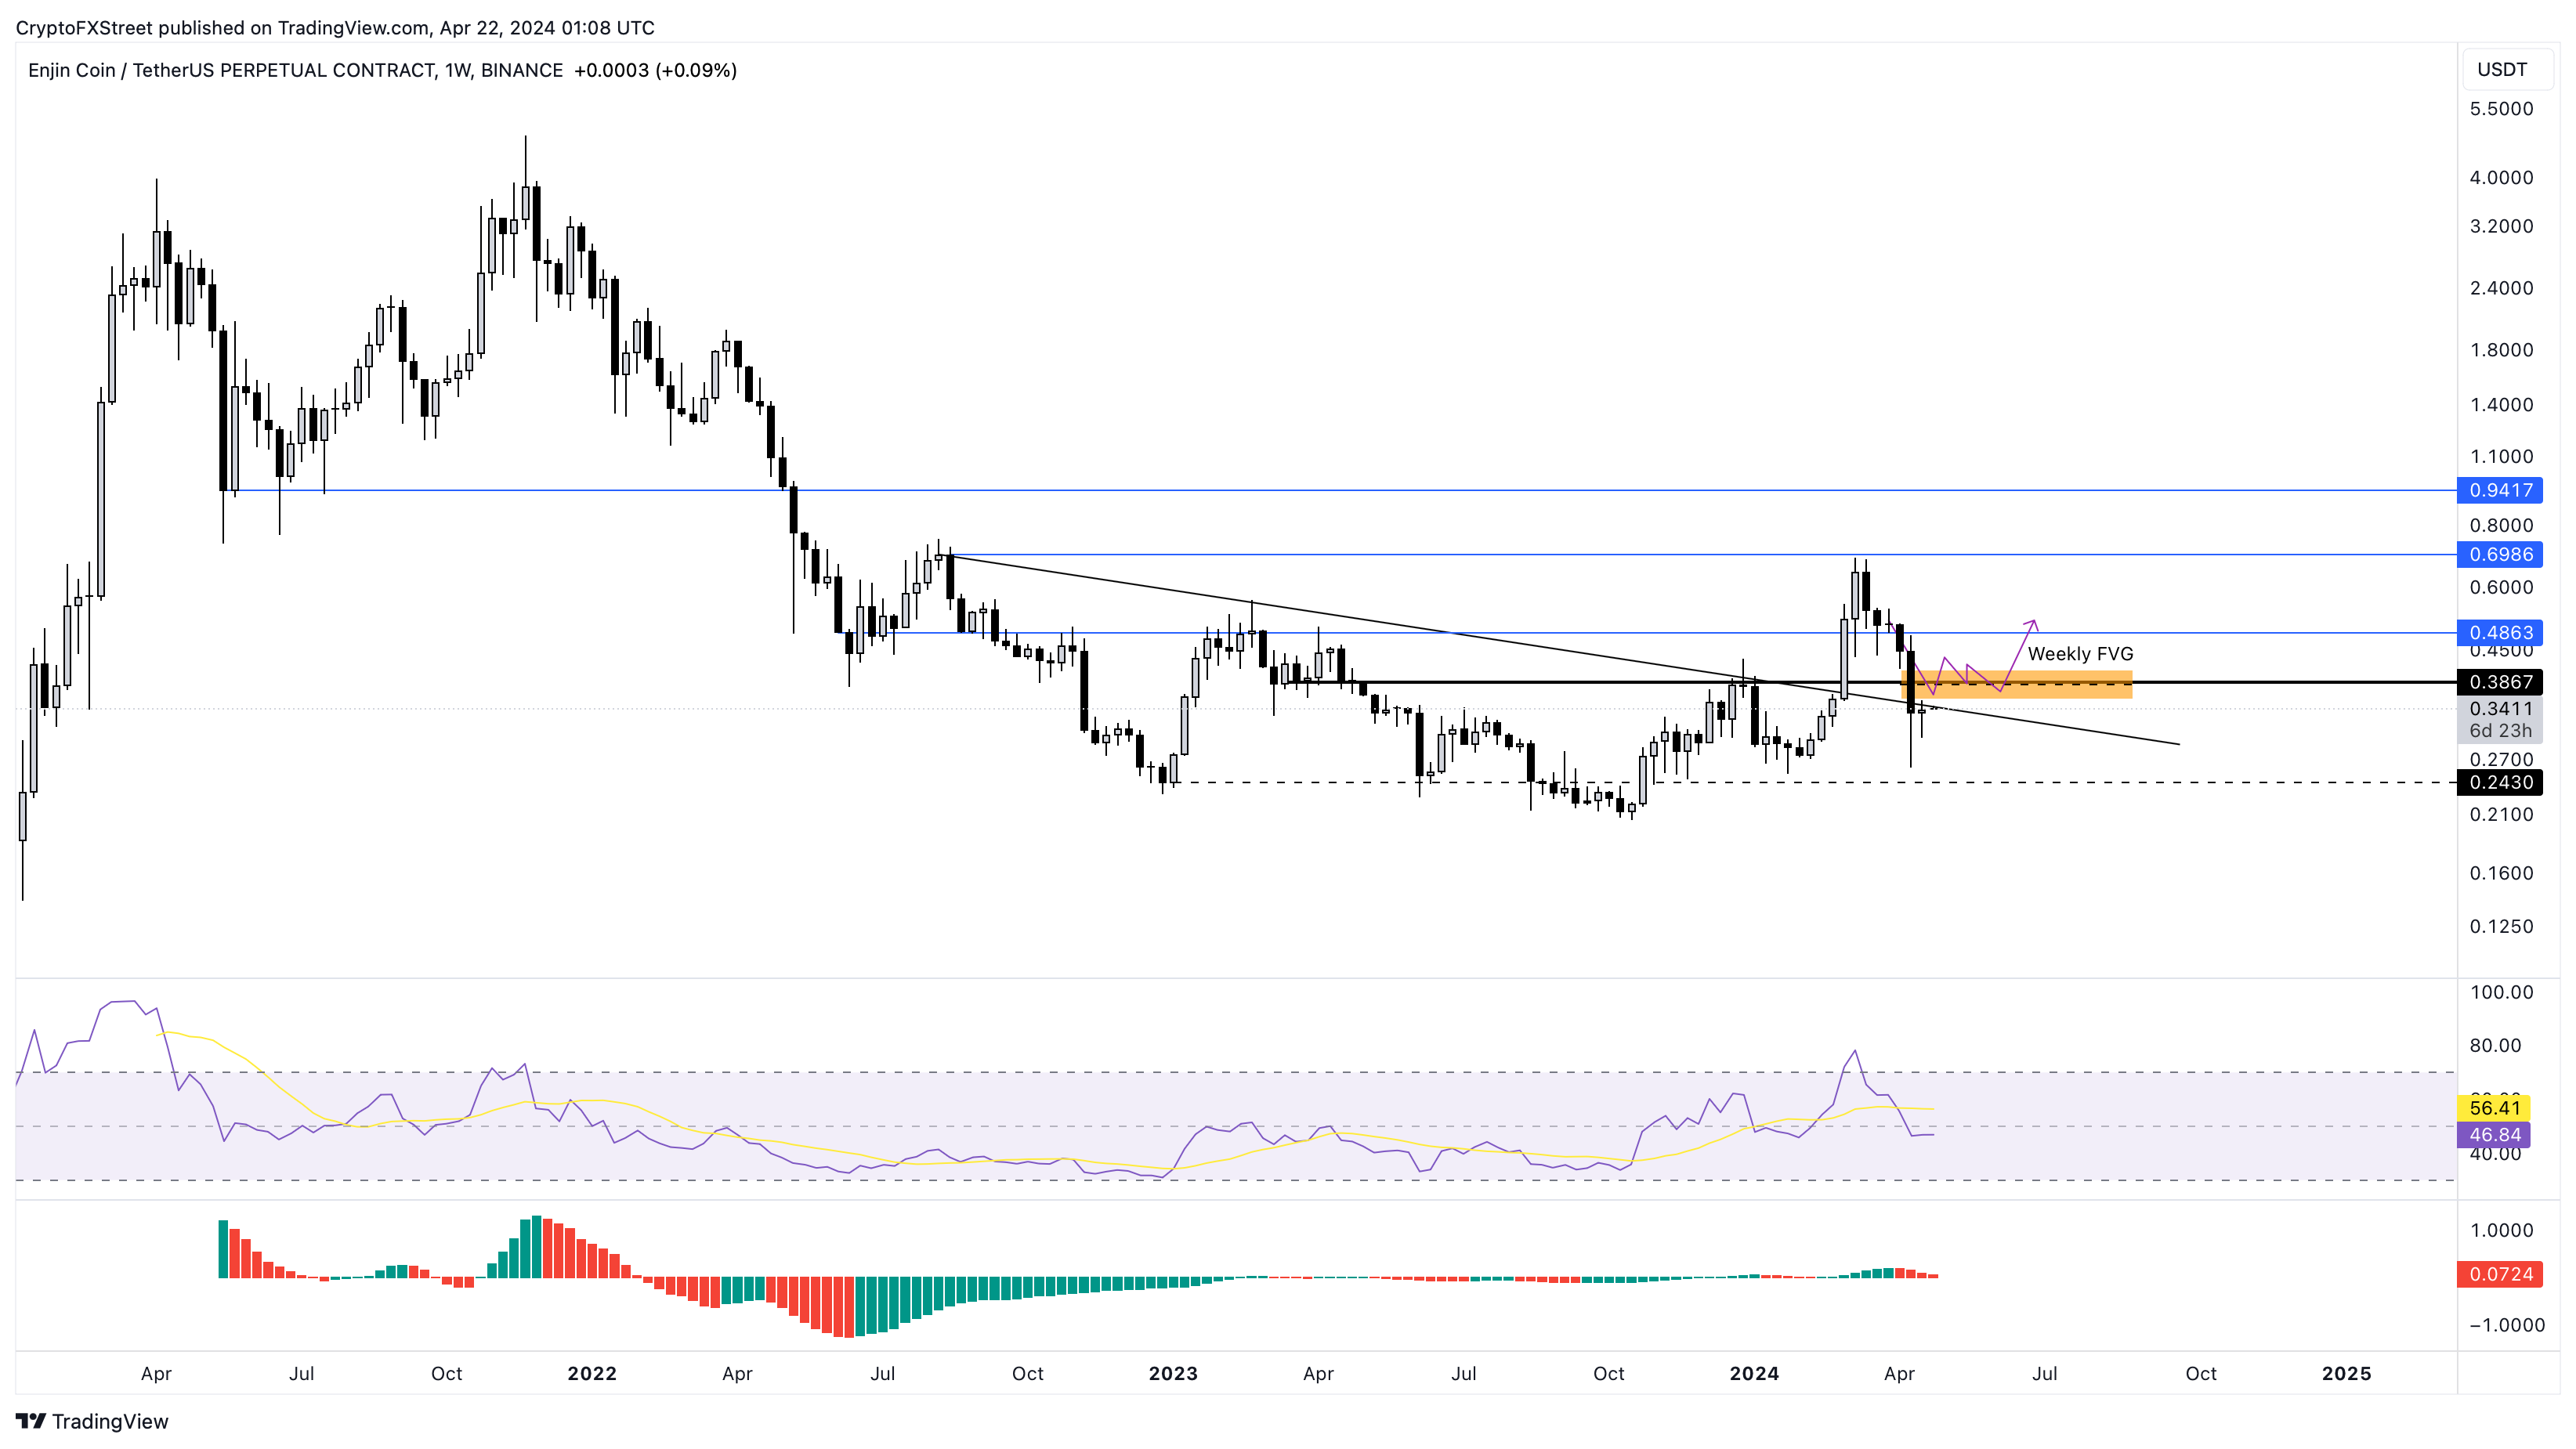
ENJ/USDT 1-week chart
ENJ’s on-chain overview
According to IntoTheBlock’s data, 56% of all ENJ holders are “Out of the Money,” and only 40% of the investors are in profit.
Due to its high 30-day correlation of 0.89 with Bitcoin price, Enjin Coin price needs to improve the overall health of the market to kickstart a bull run.
The total outflows from exchanges in the past week have amounted to $1.68 million, while inflows stand at a mere $230,000. The stark contrast between the exchange inflows and outflows suggests that more investors are moving their ENJ tokens off centralized platforms, suggesting they’re confident about the Enjin price’s recovery.

ENJ Token Summary
A further look at IntoTheBlock’s Global In/Out of the Money (GIOM) metric for Enjin Coin price shows two key “Out of the Money” clusters that could hamper the uptrend.
Between $0.374 and $0.501, 15,500 addresses accumulated 114.3 million ENJ tokens at an average price of $0.436.
Similarly, 12,700 addresses purchased 146 million ENJ between $0.501 and $1.01. Investors who bought ENJ at an average price of $0.634 are underwater.
Hence, the $0.436 and $0.634 levels are crucial hurdles that bulls must overcome to reach the $1 psychological level.
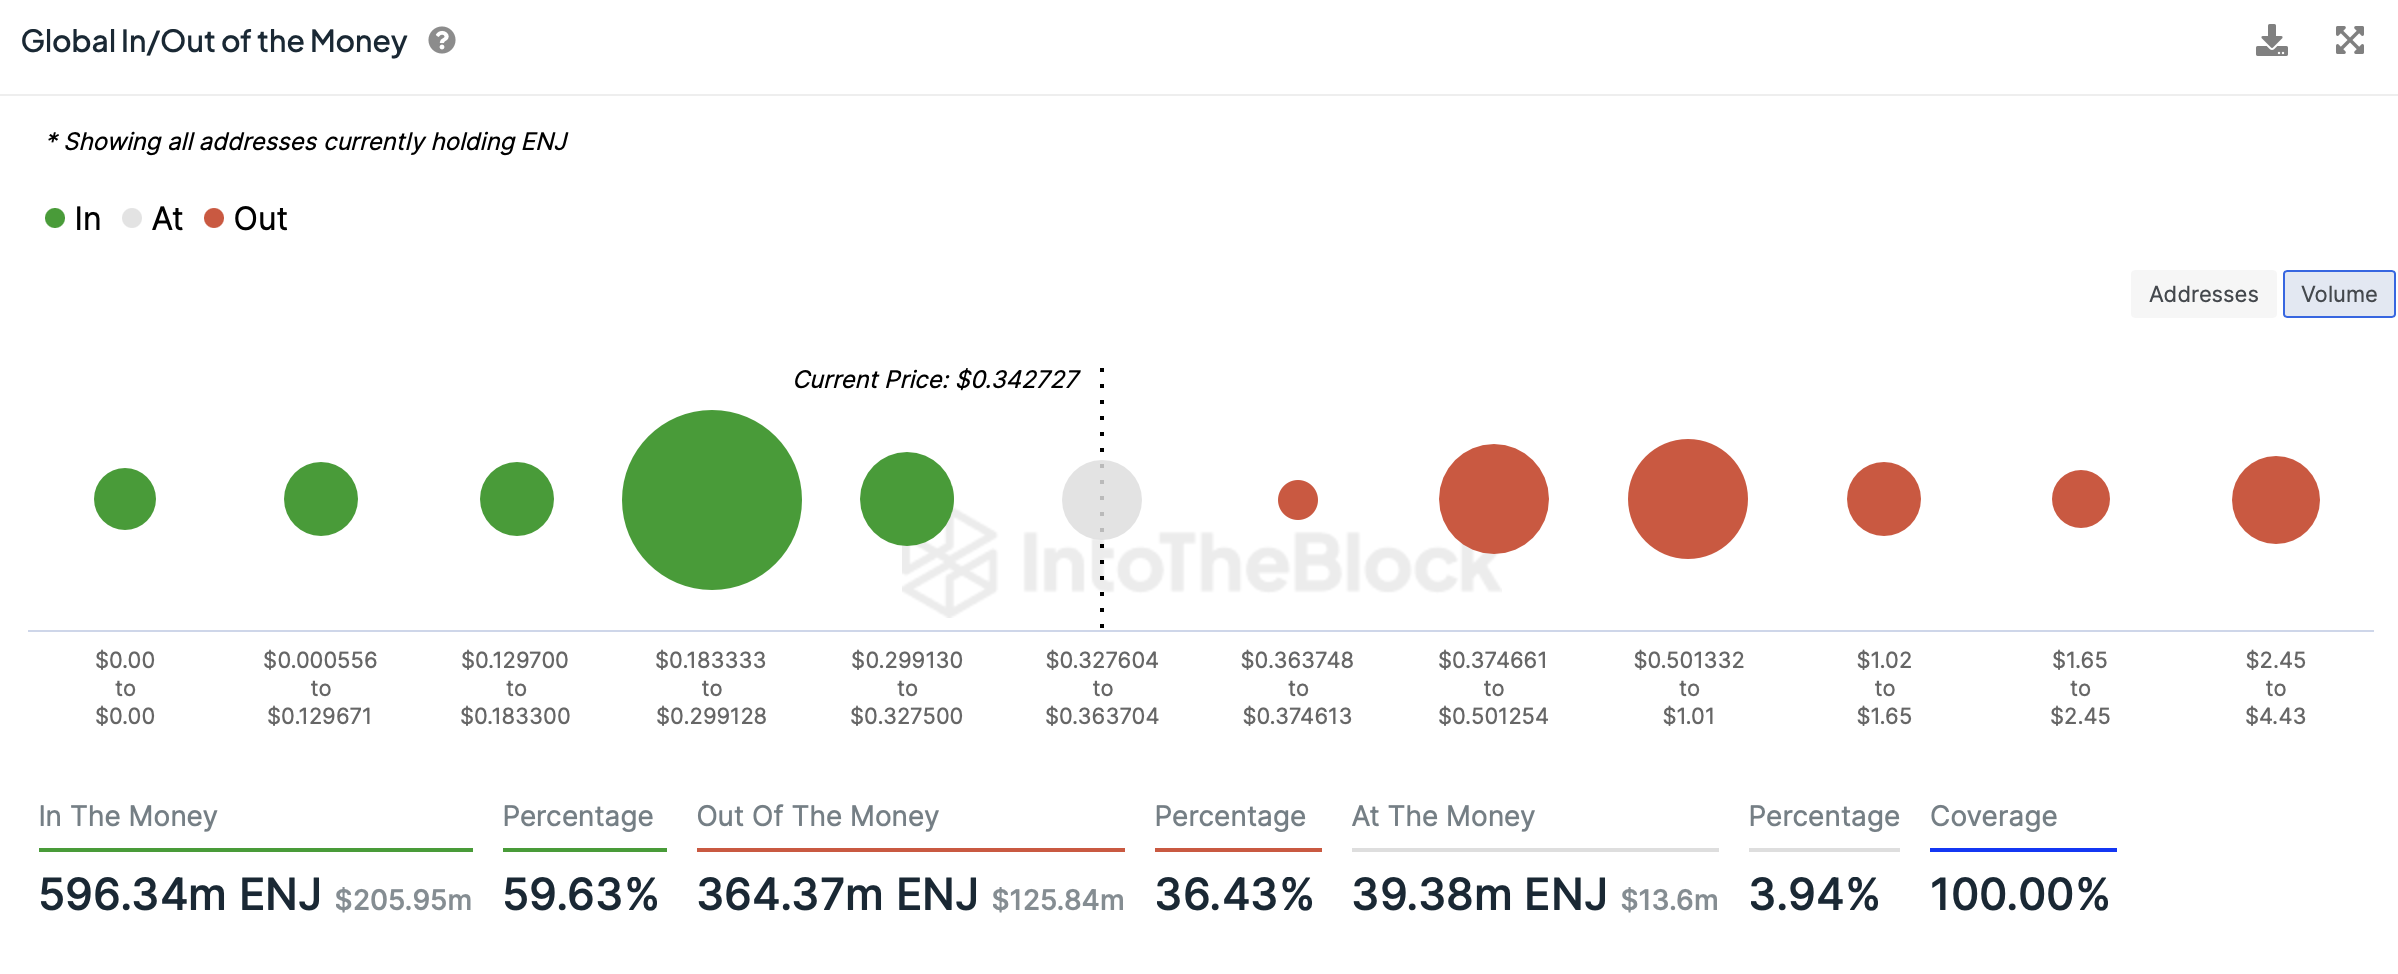
ENJ GIOM
While the outlook for Enjin Coin price might seem bullish from a theoretical perspective, investors must note that it is a long-term idea. Impatient investors who look to rotate capital at every downturn should exercise caution.
On the other hand, the invalidation level for Enjin Coin price is $0.243; a breakdown of this level or producing of a weekly candlestick close below this will produce a lower low. This move would suggest the continuation of the ongoing, long-term downtrend. Such a development could further send ENJ down by 16% to tag the local bottom at $0.203.
Considering the 200% reward and the risk of invalidation, roughly 28% from the current price level of $0.341, Enjin Coin does seem like a good altcoin to buy the dip.
Also read: How to approach the fourth Bitcoin halving as an investor - all you need to know
Recommended Articles


