


Will Celestia (TIA) Hit $130? Analyst Makes Bold Prediction
Celestia (TIA), a red-hot cryptocurrency in the modular blockchain space, has experienced a rollercoaster ride in recent weeks. After reaching a peak of nearly $16, TIA underwent a correction, plummeting to $7.5 according to CoinMarketCap data.
However, the token has displayed remarkable resilience, bouncing back to $11.50 and showcasing strong trading volume – a sign that investors haven’t abandoned ship.
Celestia’s Rebound And Investor Optimism
The past 24 hours have been particularly kind to Celestia. The token price surged by a significant 6.20%, indicating a shift in investor sentiment towards optimism. This bullish momentum is further bolstered by analyst predictions and market psychology.
TIA’s price action reveals a struggle between bullish and bearish forces. While the Fear & Greed Index sits at 72 (“Greed”) and price predictions lean bullish, the current price of $11.70 remains significantly lower than its February 10th, 2024 ATH of $20.85.
This signals a potential continuation of the downtrend. However, a key technical detail to note is the price staying above the cycle low of $7.61. This could indicate the beginning of a price recovery, but further technical analysis is necessary to confirm this.
Some 46 cryptocurrency exchanges, including Binance and KuCoin, allow traders to trade Celestia. Celestia changed hands for $549.60 million in the previous day.
Celestia: Long-Term Potential And A Bullish Breakout
Crypto analyst CryptoBullet has offered a long-term perspective on Celestia’s trajectory, focusing on its one-week chart. The analyst predicts a consolidation phase where TIA will likely trade below its previous high of $20 for an extended period.
$TIA #Celestia 1W chart
I think #TIA will consolidate below the $20 high for quite a while (maybe it will print a giant Symmetric Triangle, who knows)
In my opinion, only after this re-accumulation $TIA will be ready to go much higher
Macro target 1 – $70
— CryptoBullet (@CryptoBullet1) April 18, 2024

This consolidation could potentially form a bullish “Symmetric Triangle” pattern, a technical indicator often seen before significant price breakouts. CryptoBullet believes that after this consolidation and re-accumulation period,
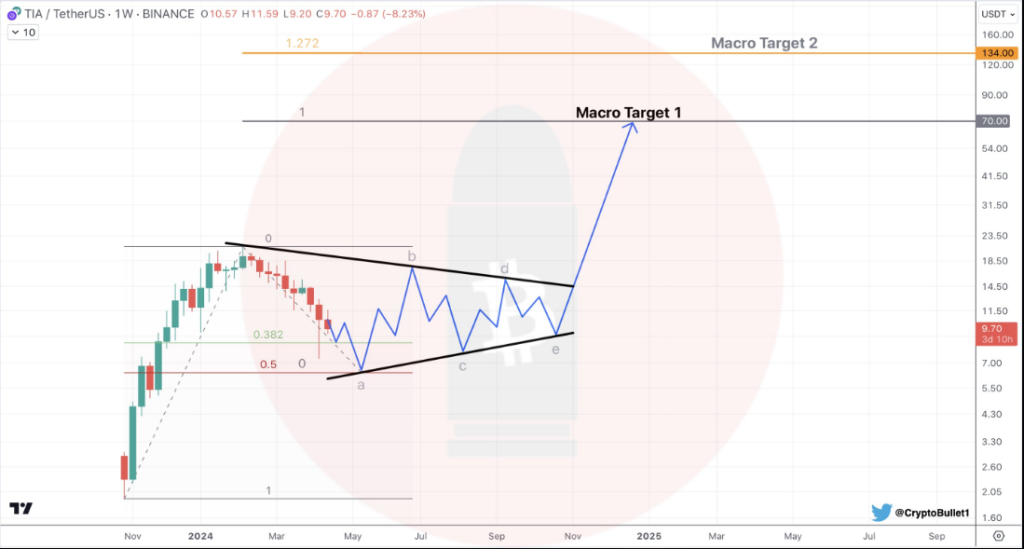
TIA will experience a substantial rise, with ambitious macro price targets set at a staggering $70 and even $130. While these targets are lofty, they highlight the analyst’s belief in Celestia’s long-term potential.
Celestia’s Underlying Value PropositionThe recent bullish sentiment surrounding Celestia isn’t solely driven by speculation. Celestia is a modular data availability network, a foundational technology that underpins the scalability and security of blockchains.
By offering a secure platform for developers to launch their own blockchains, Celestia positions itself as a crucial piece of infrastructure in the burgeoning blockchain ecosystem. This underlying value proposition, coupled with the recent positive market forces, is propelling Celestia into the spotlight.
Will TIA Reach $130?While predicting specific price points like $130 is inherently difficult in the volatile cryptocurrency market, Celestia’s future trajectory remains intriguing. Bullish sentiment and a Greed market mood suggest potential for price appreciation.
However, the significant drop from its all-time high and the unknown influence of future news and developments necessitate caution. Technical analysis using indicators and monitoring upcoming events can provide more clarity on Celestia’s price direction.
Featured image from Pexels, chart from TradingView
Recommended Articles


