Sei Price Prediction: A bounce from here could signal a bullish trend for SEI

Source Fxstreet
  • Sei price is holding above critical support at $0.4732 based on recent price action
  • SEI could rise to $0.8000 amid rising momentum and two buy signals in the works.
  • A break and close below $0.4000 would invalidate the bullish thesis.

Sei (SEI) price is nurturing a recovery rally after a fall of nearly 40% starting April 9. With the SEI bulls defending against further downside, the altcoin could be primed for a growth in bullish momentum.

Also Read: SEI, Omni Foundation propose standard to unify Ethereum NFTs

SEI could rally 40% if altcoins show strength

Altcoins could have their rally now that the Bitcoin halving has concluded. For the Sei price, this could mean a climb of around 38% as bulls defend against further downside. On the 1-day timeframe, the altcoin is at a make-or-break support level of $0.4732 based on recent price action. A bounce from here could signal a bullish trend ahead.

If the SEI bulls can muster enough strength to stay above this support zone, it would provide a good jumping-off point for the Sei price to keep the momentum going. Already, the altcoin has flipped the 200-day Simple Moving Average (SMA) into support, with eyes now set on the $0.8000 target. Such a move would denote a climb of almost 38% above current levels. To get here, however, the bulls must overcome the resistance confluence between the 100- and 50-day SMA at $0.7554 and $0.7647 respectively.

Notice also that both the Relative Strength Index (RSI) and the Moving Average Convergence Divergence (MACD) are flirting with a confirmed bullish cross over above their respective signal lines, interpreted as buying signals.

In a highly bullish case, the Sei price could shatter the $0.8000 blockade, extending the gains to tag the $1.0000 psychological level,  or in a highly bullish case, reach to reclaim the $1.1450 range high.

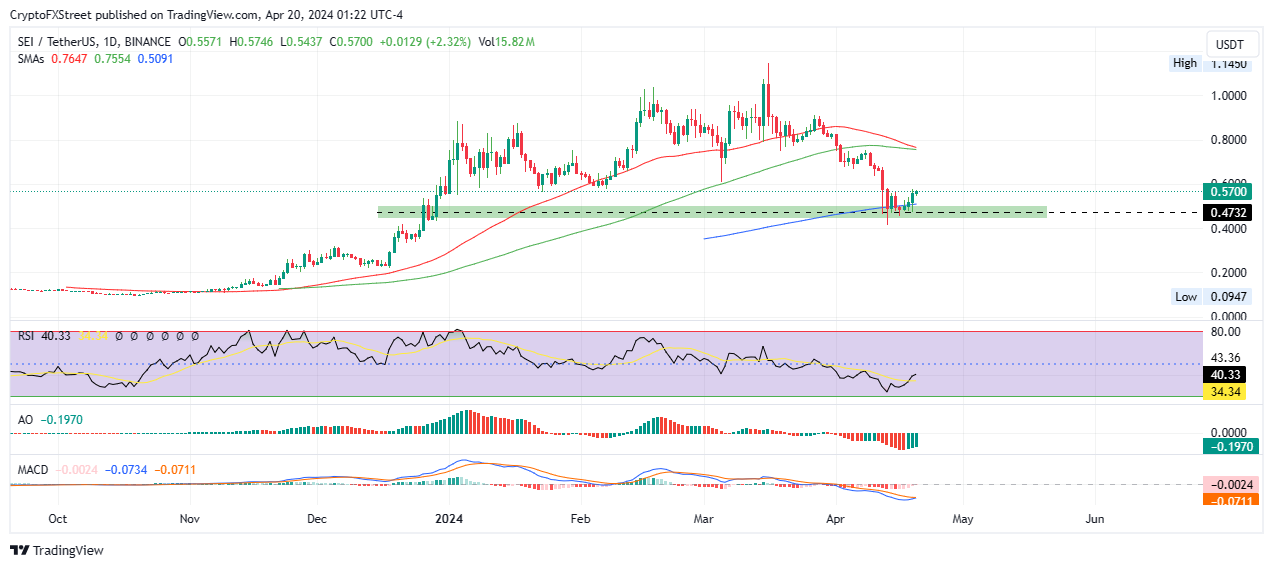
SEI/USDT 1-day chart

On the other hand, if bulls begin to cash in on the nearly 20% gains made over the past four days, the Sei price could drop. A daily candlestick close below the $0.4000 psychological level would invalidate the bullish thesis.

Disclaimer: For information purposes only. Past performance is not indicative of future results.
placeholder
Gold Price Forecast: XAU/USD drifts higher above $4,200 as Fed delivers expected cutGold price (XAU/USD) gains momentum to around $4,235 during the early Asian session on Thursday. The precious metal extends its upside after the US Federal Reserve (Fed) delivered an expected third consecutive interest rate cut and maintained its outlook for just one cut in 2026.
Author  FXStreet
Dec 11, Thu
Gold price (XAU/USD) gains momentum to around $4,235 during the early Asian session on Thursday. The precious metal extends its upside after the US Federal Reserve (Fed) delivered an expected third consecutive interest rate cut and maintained its outlook for just one cut in 2026.
placeholder
Gold remains bid as lack of Fed clarity and geopolitical frictions persistGold (XAU/USD) advances modestly on Friday as traders seem to book profits ahead of the weekend, yet clings to gains of over 0.51% after reaching a seven-week high of $4,353. At the time of writing, XAU/USD trades at $4,302 as traders digest comments from Federal Reserve (Fed) officials.
Author  FXStreet
Yesterday 01: 34
Gold (XAU/USD) advances modestly on Friday as traders seem to book profits ahead of the weekend, yet clings to gains of over 0.51% after reaching a seven-week high of $4,353. At the time of writing, XAU/USD trades at $4,302 as traders digest comments from Federal Reserve (Fed) officials.
placeholder
Ethereum Price Slips Lower — $3,000 Looms as the Key BattlegroundEthereum is attempting to recover from a $3,026 low but remains below $3,200 and the 100-hour SMA, with a bearish trend line near $3,175 capping rebounds as bulls need a clean break above $3,200 to target $3,250–$3,400, while a drop below $3,050 risks a retest of $3,000 and $2,940.
Author  Mitrade
Yesterday 03: 25
Ethereum is attempting to recover from a $3,026 low but remains below $3,200 and the 100-hour SMA, with a bearish trend line near $3,175 capping rebounds as bulls need a clean break above $3,200 to target $3,250–$3,400, while a drop below $3,050 risks a retest of $3,000 and $2,940.
placeholder
Macro Analysts: Hawkish Japan Could Push Bitcoin Below $70KAnalysts predict Bitcoin may face further declines towards the $70,000 mark if the Bank of Japan raises interest rates as expected.
Author  Mitrade
Yesterday 05: 48
Analysts predict Bitcoin may face further declines towards the $70,000 mark if the Bank of Japan raises interest rates as expected.
placeholder
Bitcoin Slides 5% as Sellers Lean In — Can BTC Reclaim $88,000?Bitcoin has dropped back below $88,000 after rolling over from $90,500, with price still trading under the 100-hour Simple Moving Average. The sell-off found a floor at $85,151, and BTC is now consolidating near that base, but rebounds are facing pressure from a bearish trend line around $89,000. Bulls need to retake $88,000–$89,000 to ease downside risk; failure to do so keeps $85,500–$85,000 and then $83,500 in play, with $80,000 as the deeper “line in the sand.” Bitcoin (BTC) is back in damage-control mode after a sharp pullback wiped out recent gains. The price failed to reclaim the $90,000–$90,500 band, rolled over, and slid through $88,500 before briefly dipping under $87,000. Buyers did show up around $85,000, but the rebound so far looks more like stabilization than a clear trend reversal. Bitcoin dips hard, finds a bid near $85,000(h3) BTC’s latest move lower began when it couldn’t build follow-through above $90,000 and $90,500. Once that upside stalled, sellers took control and pushed price down through $88,500. The slide accelerated enough to spike below $87,000, but the market didn’t free-fall. Bulls defended the $85,000 zone, printing a low at $85,151. Since then, Bitcoin has been consolidating below the 23.6% Fibonacci retracement of the drop from the $93,560 swing high to the $85,151 low — a clue that the bounce is still shallow and that sellers haven’t fully backed off yet. Structurally, BTC is still on the back foot: It’s trading below $88,000, and It remains below the 100-hour Simple Moving Average, keeping short-term trend pressure pointed downward. Resistance is layered, and $89,000 is the problem area(h3) If bulls try to turn this into a recovery, they’ll have to climb through multiple ceilings in quick succession. First, BTC faces resistance around $87,150, followed by a more meaningful barrier near $87,500. From there, the market’s attention snaps back to $88,000 — the level BTC just lost and now needs to reclaim. A close back above $88,000 would improve the tone, but it doesn’t solve the bigger issue: there’s a bearish trend line on the hourly BTC/USD chart (Kraken feed) with resistance near $89,000, which also lines up with the next technical hurdle. If BTC can push through $89,000 and hold, the rebound could extend toward $90,000, with follow-through targets at $91,000 and $91,500. But until price clears that $88,000–$89,000 zone, rallies are at risk of being sold rather than chased. If BTC fails to reclaim resistance, the downside path is clear(h3) The near-term bear case is simple: if Bitcoin can’t climb back above the $87,000 area and keep traction, sellers may attempt another leg lower. Support levels line up like this: Immediate support: $85,500 First major support: $85,000 Next support: $83,500 Then $82,500 in the near term Below that, the major “don’t break this” level is still $80,000. If BTC slips under $80,000, the risk of acceleration to the downside increases significantly — not because it’s magic, but because it’s the kind of psychological and structural level that tends to trigger forced de-risking. Indicators: momentum still leans bearish(h3) The intraday indicators aren’t offering much comfort yet: Hourly MACD is losing pace in the bearish zone. Hourly RSI remains below 50, suggesting sellers still have the upper hand on short timeframes. So while the $85,000 defense held for now, the market hasn’t flipped bullish — it’s just stopped bleeding.
Author  Mitrade
11 hours ago
Bitcoin has dropped back below $88,000 after rolling over from $90,500, with price still trading under the 100-hour Simple Moving Average. The sell-off found a floor at $85,151, and BTC is now consolidating near that base, but rebounds are facing pressure from a bearish trend line around $89,000. Bulls need to retake $88,000–$89,000 to ease downside risk; failure to do so keeps $85,500–$85,000 and then $83,500 in play, with $80,000 as the deeper “line in the sand.” Bitcoin (BTC) is back in damage-control mode after a sharp pullback wiped out recent gains. The price failed to reclaim the $90,000–$90,500 band, rolled over, and slid through $88,500 before briefly dipping under $87,000. Buyers did show up around $85,000, but the rebound so far looks more like stabilization than a clear trend reversal. Bitcoin dips hard, finds a bid near $85,000(h3) BTC’s latest move lower began when it couldn’t build follow-through above $90,000 and $90,500. Once that upside stalled, sellers took control and pushed price down through $88,500. The slide accelerated enough to spike below $87,000, but the market didn’t free-fall. Bulls defended the $85,000 zone, printing a low at $85,151. Since then, Bitcoin has been consolidating below the 23.6% Fibonacci retracement of the drop from the $93,560 swing high to the $85,151 low — a clue that the bounce is still shallow and that sellers haven’t fully backed off yet. Structurally, BTC is still on the back foot: It’s trading below $88,000, and It remains below the 100-hour Simple Moving Average, keeping short-term trend pressure pointed downward. Resistance is layered, and $89,000 is the problem area(h3) If bulls try to turn this into a recovery, they’ll have to climb through multiple ceilings in quick succession. First, BTC faces resistance around $87,150, followed by a more meaningful barrier near $87,500. From there, the market’s attention snaps back to $88,000 — the level BTC just lost and now needs to reclaim. A close back above $88,000 would improve the tone, but it doesn’t solve the bigger issue: there’s a bearish trend line on the hourly BTC/USD chart (Kraken feed) with resistance near $89,000, which also lines up with the next technical hurdle. If BTC can push through $89,000 and hold, the rebound could extend toward $90,000, with follow-through targets at $91,000 and $91,500. But until price clears that $88,000–$89,000 zone, rallies are at risk of being sold rather than chased. If BTC fails to reclaim resistance, the downside path is clear(h3) The near-term bear case is simple: if Bitcoin can’t climb back above the $87,000 area and keep traction, sellers may attempt another leg lower. Support levels line up like this: Immediate support: $85,500 First major support: $85,000 Next support: $83,500 Then $82,500 in the near term Below that, the major “don’t break this” level is still $80,000. If BTC slips under $80,000, the risk of acceleration to the downside increases significantly — not because it’s magic, but because it’s the kind of psychological and structural level that tends to trigger forced de-risking. Indicators: momentum still leans bearish(h3) The intraday indicators aren’t offering much comfort yet: Hourly MACD is losing pace in the bearish zone. Hourly RSI remains below 50, suggesting sellers still have the upper hand on short timeframes. So while the $85,000 defense held for now, the market hasn’t flipped bullish — it’s just stopped bleeding.
goTop
quote