

Ethereum resumes sideways trend, buyback yield tops Tesla and JP Morgan
- Ethereum whale jumps on ‘buy the dip’ opportunity after Israel's attack on Iran.
- The buyback yield of Ethereum exceeds that of major S&P 500 firms.
- Ethereum may continue trading inside key range as investors await the market's response to Bitcoin halving.
Ethereum resumed its sideways movement on Friday after briefly crashing due to Israel's attack on Iran. The move presented a buying opportunity for a whale, who quickly profited from it. This also comes when Ethereum's buyback yield exceeds that of several S&P 500 firms.
Read more: Ethereum shows firm support at key level as its correlation with US indices increase
Daily digest market movers: Israel's retaliation, whale activity, buyback yields, Hong Kong's ETH ETF
Ethereum wasn't left out, as the entire crypto market took a hit on Friday following Israel's strike in retaliation to Iran's attack on April 13. Here are your key market movers:
- As ETH dipped briefly on Friday, a whale jumped on the opportunity, spending 9.5 million USDT to buy 3,253 ETH at ~$ $2,925, according to crypto analytics platform Spot On Chain. However, ETH's price has quickly recovered, especially as Iranian officials have downplayed responding to the attack. As a result, the whale made nearly $625,000 in unrealized profit.
- Ethereum is outshining major tech and financial giants in terms of buyback yields, according to Token Terminal. In a list of $200 billion+ finance and tech S&P 500 companies, including Apple, Alphabet and Berkshire Hathaway, Ethereum ranks number 16, above Tesla and JPMorgan with a buyback yield of 0.23%.
Buyback for Ethereum, in this case, is implemented through token burns that began after The Merge in 2022. The number one smart contract blockchain achieved this feat in only nine years compared to the median age of 44 years of other companies in the list.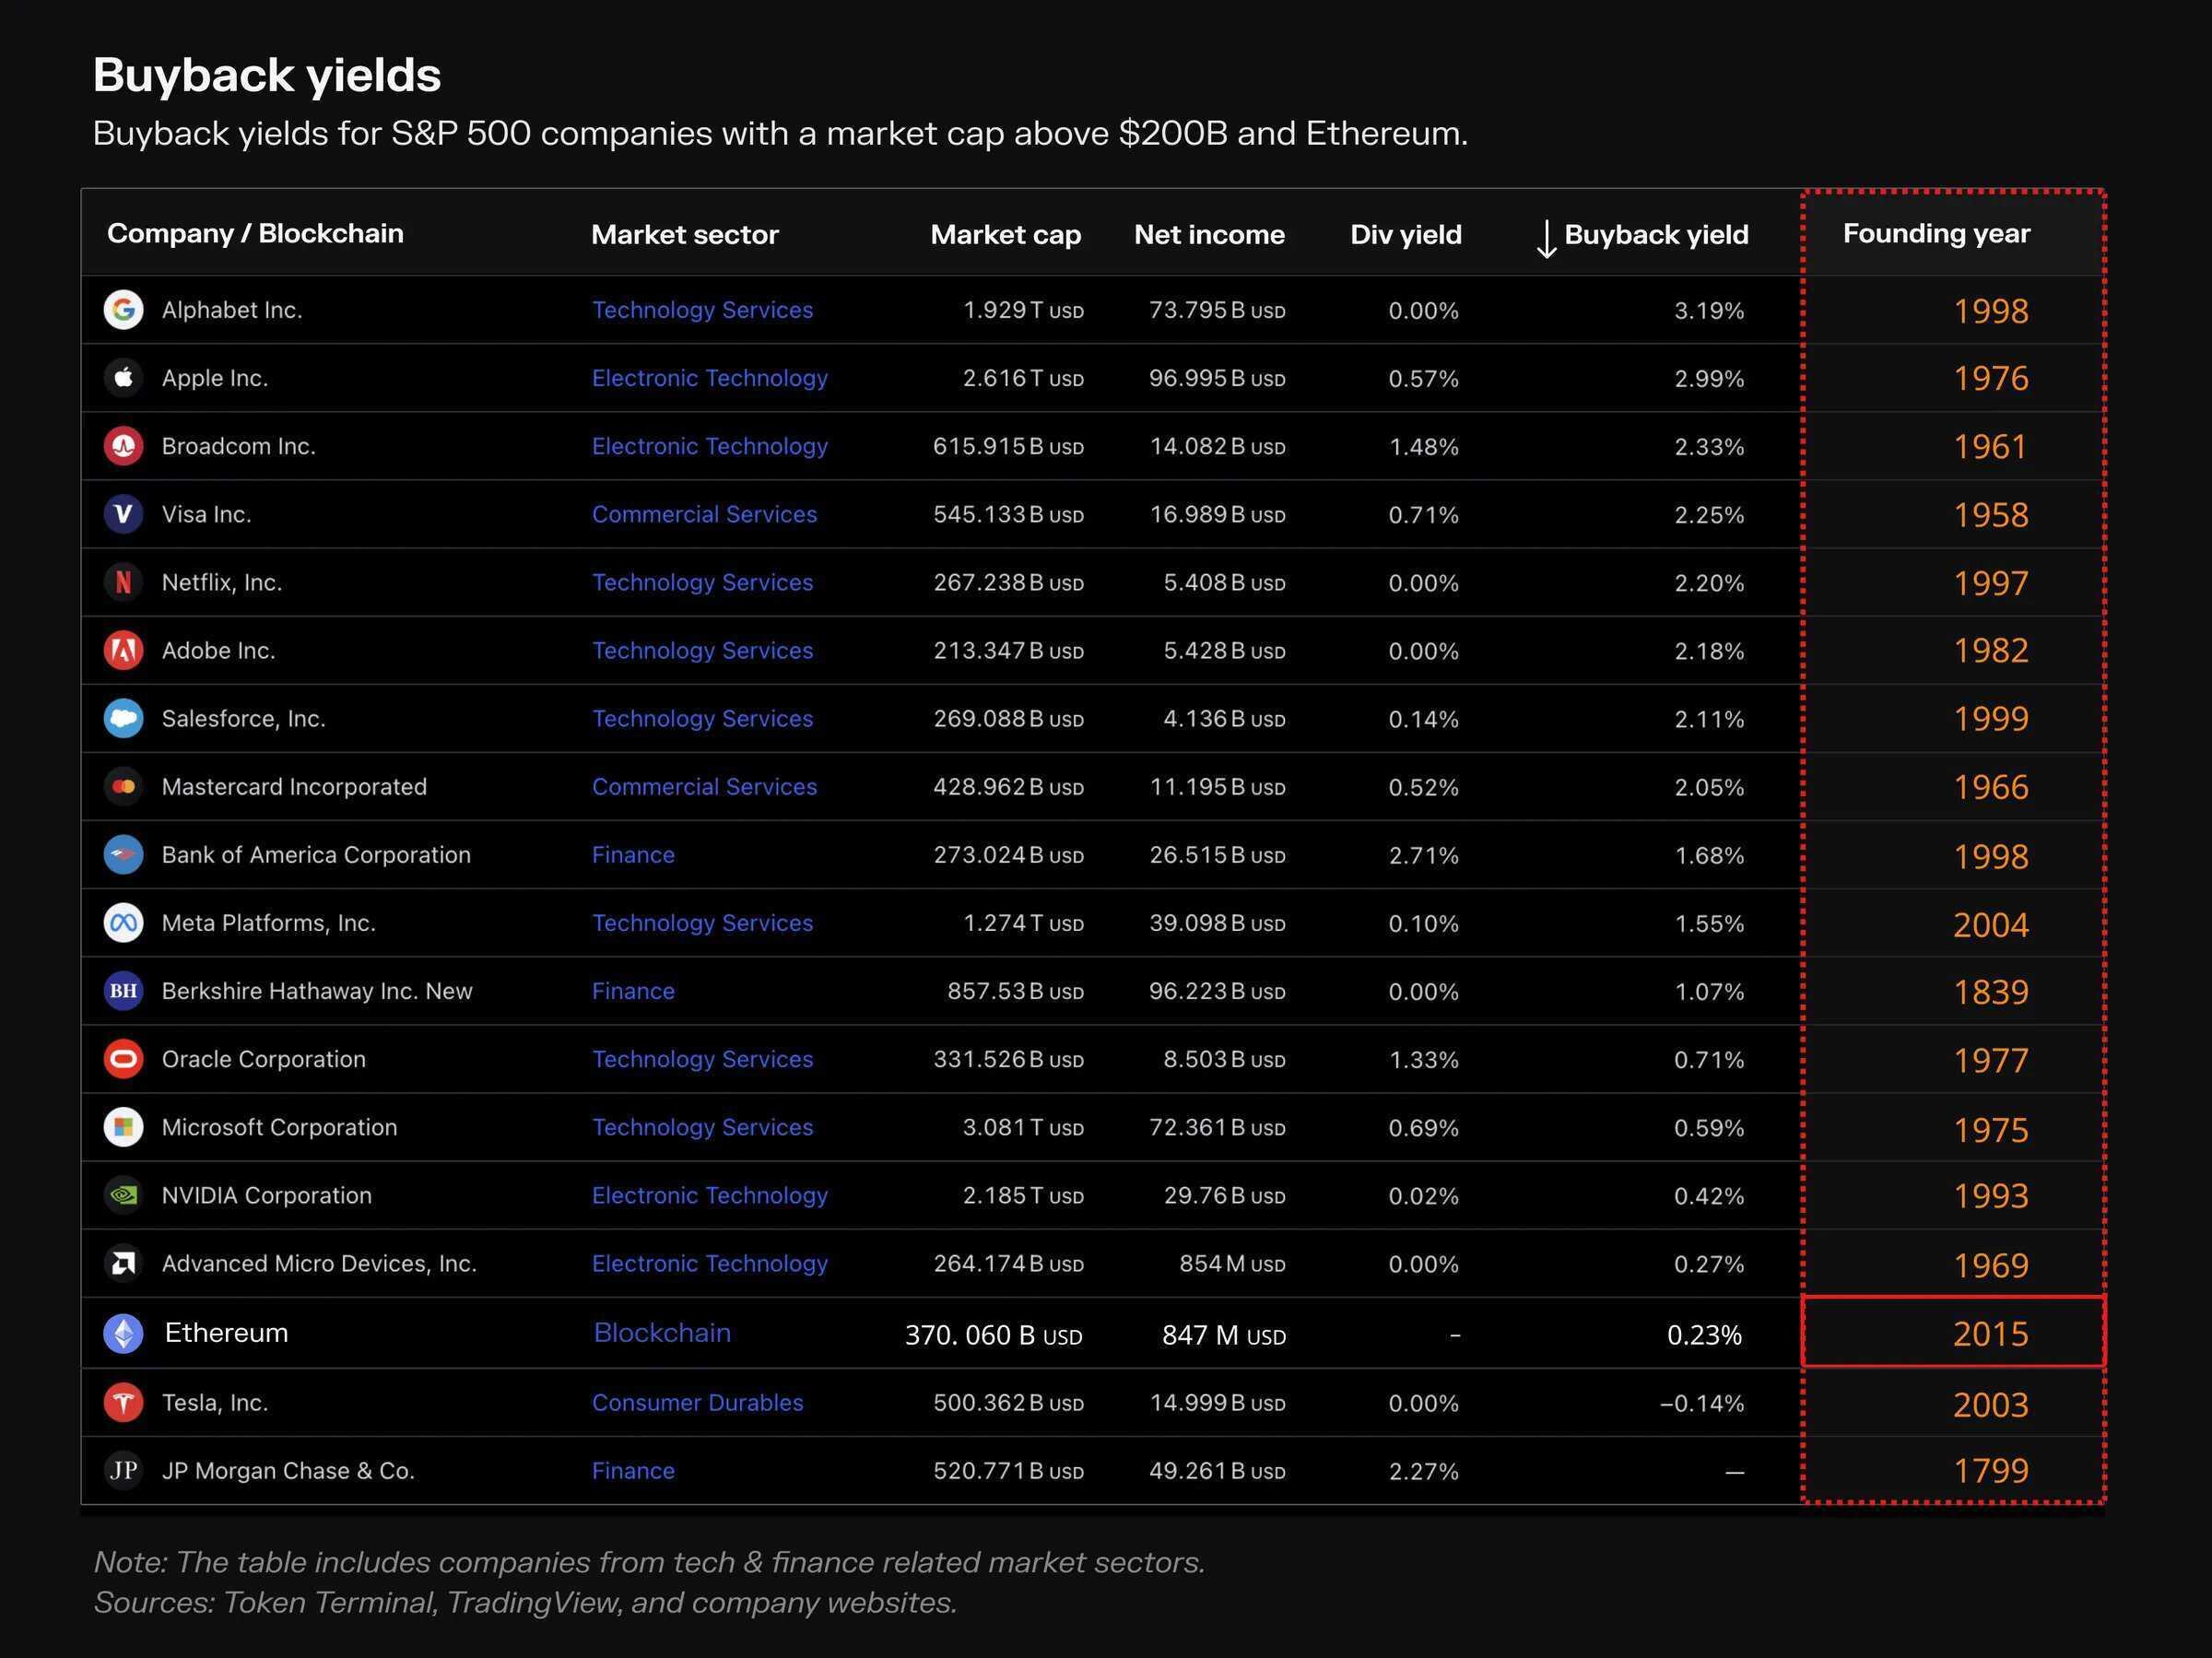
ETH buyback yield
Also read: Ethereum moves sideways as Q1 report indicates token burns are making it deflationary
- Meanwhile, Bloomberg ETF analyst Eric Balchunas expressed doubts that Mainland China investors may not get access to Hong Kong's spot ETH ETFs when they start trading. This pessimism is based on China's ban on all crypto-related activities in 2021. However, other analysts have pointed to Hong Kong's positive reception to crypto investment as a good sign that spot ETH ETFs would see impressive inflows when they launch in the region.
- Despite ETH's brief price decline, ETH's long liquidations weren't heavy, sitting around $34.4 million in the past 24 hours. This may be due to heavy liquidations already seen earlier in the week.
Technical analysis: ETH may continue trading inside key range
ETH attempted to break the $2,852 support on Friday after Israel attacked Iran. However, prices have quickly bounced back, and ETH appears to be continuing its consolidation. The calm may be due to investors exercising caution as they await how the market responds to Bitcoin's fourth halving, which is a few hours away.
Read more: Ethereum declines as crypto market crash increases bearish sentiment
Considering that many analysts have predicted that Bitcoin halving is already priced in, ETH may experience light volatility in the next few hours.
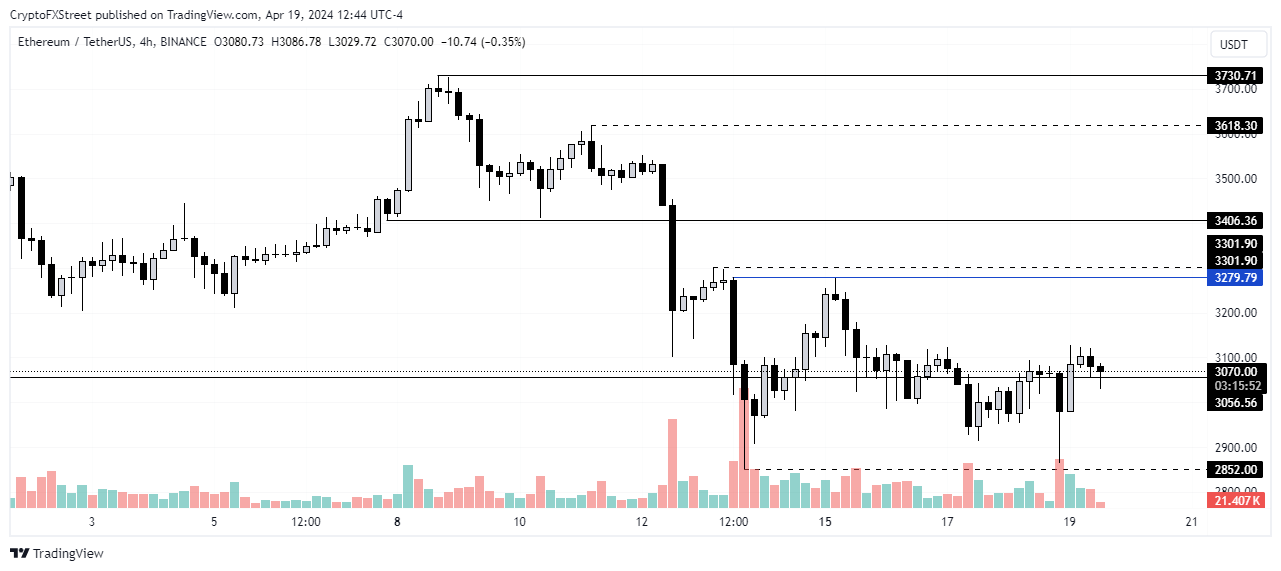
ETH/USDT 4-hour chart
But in the coming weeks, it won't go outside the range of $2,852 and $3,406 formed in recent price movements, except if major external factors prevail on its price. In the long term, ETH could test the resistance of $3,730. An unlikely approval of spot ETH ETFs by the Securities & Exchange Commission (SEC) would send it past the $4,000 key level to a new all-time high.
Bitcoin, altcoins, stablecoins FAQs
Bitcoin is the largest cryptocurrency by market capitalization, a virtual currency designed to serve as money. This form of payment cannot be controlled by any one person, group, or entity, which eliminates the need for third-party participation during financial transactions.
Altcoins are any cryptocurrency apart from Bitcoin, but some also regard Ethereum as a non-altcoin because it is from these two cryptocurrencies that forking happens. If this is true, then Litecoin is the first altcoin, forked from the Bitcoin protocol and, therefore, an “improved” version of it.
Stablecoins are cryptocurrencies designed to have a stable price, with their value backed by a reserve of the asset it represents. To achieve this, the value of any one stablecoin is pegged to a commodity or financial instrument, such as the US Dollar (USD), with its supply regulated by an algorithm or demand. The main goal of stablecoins is to provide an on/off-ramp for investors willing to trade and invest in cryptocurrencies. Stablecoins also allow investors to store value since cryptocurrencies, in general, are subject to volatility.
Bitcoin dominance is the ratio of Bitcoin's market capitalization to the total market capitalization of all cryptocurrencies combined. It provides a clear picture of Bitcoin’s interest among investors. A high BTC dominance typically happens before and during a bull run, in which investors resort to investing in relatively stable and high market capitalization cryptocurrency like Bitcoin. A drop in BTC dominance usually means that investors are moving their capital and/or profits to altcoins in a quest for higher returns, which usually triggers an explosion of altcoin rallies.
Recommended Articles


