

Ethereum maintains horizontal trend similar to top US index funds
- Ethereum's correlation with the traditional market is now higher than Bitcoin's.
- Ethereum restakers may be responsible for its strong support just below the $3,000 level.
- Ethereum could trade sideways for weeks until the SEC's spot Ethereum ETF decision.
Ethereum's (ETH) price continued a sideways movement on Thursday as the market still awaits a trigger. Ethereum isn't alone in this horizontal trend; several major index funds have also traded sideways, underscoring ETH's positive correlation with the traditional financial market.
Read more: Ethereum moves sideways as Q1 report indicates token burns are making it deflationary
Daily digest market movers: traditional market correlation, whale activity, fragile long side
Ethereum has maintained a sideways price movement for the third consecutive day. Here are ETH's key market movers:
- Despite the recent launch of spot Bitcoin (BTC) ETFs in the US, Ethereum's correlation to the traditional market has soared above that of BTC, according to data from The Block. Compared to BTC, Ethereum showed a high correlation to indices like the Nasdaq 100, S&P 500 and Dow Jones Industrial Average. This can be seen in Ethereum's recent price action, which has traded horizontally in tandem with these indices.
- While ETH's price stagnates, whales are making moves behind the scenes. A participant in its initial coin offering (ICO) came online to sell 2,000 ETH for 6 million USDC at $2,997, according to Spot On Chain. The whale bought 33,213 ETH at $0.31 during the Ethereum Genesis ICO. Since then, the whale has sold 5,110 ETH and still holds about 29,700 ETH across three wallets.
Another whale, who spent 10 million USDT to buy 3,279 ETH at $3,050 on Wednesday, withdrew 21,474 ETH — worth $64.7 million — from Binance on Thursday, according to Lookonchain. The whale has bought 107,931 ETH from decentralized exchanges and Binance since April 8.
Also read: Ethereum declines as crypto market crash increases bearish sentiment
- Options indicators also show that "the long side of Ethereum is more fragile and have limited ability to lead the market," according to Greekslive.
Technical analysis: ETH sideways movement may continue for weeks
Ethereum bears attempted to shift its price below the $2,900 key level on Wednesday, but it quickly rebounded to the $3,000 support level on Thursday.
ETH has maintained trading around the range of $2,900 and $3,300 since the market crash of April 12. Despite bulls showing weak hands, bears haven't been able to break below the range.
The scarcity of ETH driven by the increased attractiveness of Ethereum restaking and anticipation of the Bitcoin halving may be what's sustaining its price to stay within the range.
Read more: Ethereum recovers from dip as Hong Kong ETH ETF approval sparks whale buying spree
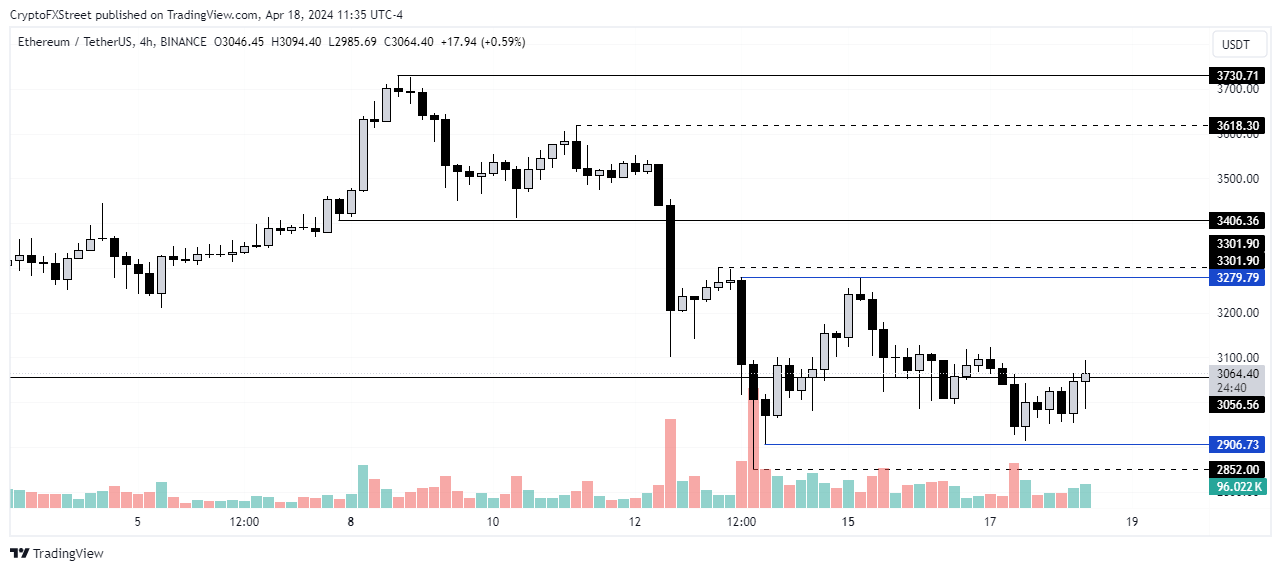
ETH/USDT 4-hour chart
As stated in a previous analysis, ETH may continue the sideways movement. Minor market triggers may see it posting tiny gains but not above or below the $3,300 and $2,852 range identified previously.
The sideways movement may prevail for weeks until days leading to the Securities & Exchange Commission's decision on a spot Ethereum ETF. This thesis would be invalidated if the Bitcoin halving triggers an unlikely rally.
Ethereum is trading at $3,062, up 1.7% on the day.
Bitcoin, altcoins, stablecoins FAQs
Bitcoin is the largest cryptocurrency by market capitalization, a virtual currency designed to serve as money. This form of payment cannot be controlled by any one person, group, or entity, which eliminates the need for third-party participation during financial transactions.
Altcoins are any cryptocurrency apart from Bitcoin, but some also regard Ethereum as a non-altcoin because it is from these two cryptocurrencies that forking happens. If this is true, then Litecoin is the first altcoin, forked from the Bitcoin protocol and, therefore, an “improved” version of it.
Stablecoins are cryptocurrencies designed to have a stable price, with their value backed by a reserve of the asset it represents. To achieve this, the value of any one stablecoin is pegged to a commodity or financial instrument, such as the US Dollar (USD), with its supply regulated by an algorithm or demand. The main goal of stablecoins is to provide an on/off-ramp for investors willing to trade and invest in cryptocurrencies. Stablecoins also allow investors to store value since cryptocurrencies, in general, are subject to volatility.
Bitcoin dominance is the ratio of Bitcoin's market capitalization to the total market capitalization of all cryptocurrencies combined. It provides a clear picture of Bitcoin’s interest among investors. A high BTC dominance typically happens before and during a bull run, in which investors resort to investing in relatively stable and high market capitalization cryptocurrency like Bitcoin. A drop in BTC dominance usually means that investors are moving their capital and/or profits to altcoins in a quest for higher returns, which usually triggers an explosion of altcoin rallies.
Recommended Articles


