
Zcash Leverage Pattern Points to a Delayed Upmove — $404 Is Now the Line to Watch?
Zcash price has cooled after a strong multi-month rally. While the token is still up more than 650% in the three-month timeframe, the recent trend has turned cautious. ZEC is down roughly 11% over the past seven days and has given back nearly 43% over the past month.
That pullback has raised a simple question. Is this just a pause, or is the rally losing strength? Leverage data, on-chain signals, and price levels suggest the answer depends on one thing: whether Zcash can reclaim $404.
Cautious Accumulation Signals Return?
Momentum indicators are sending mixed but important signals.
The Chaikin Money Flow, which tracks whether capital is entering or leaving the market, has shown a small bullish divergence between December 11 and December 17. During that period, the Zcash price made a lower high, while the CMF printed a slightly higher high. This usually hints that buying pressure is slowly returning beneath the surface.
However, CMF remains below the zero line. That matters. A value below zero indicates that net capital flow remains negative overall. While buyers are present, they are cautious rather than aggressive.
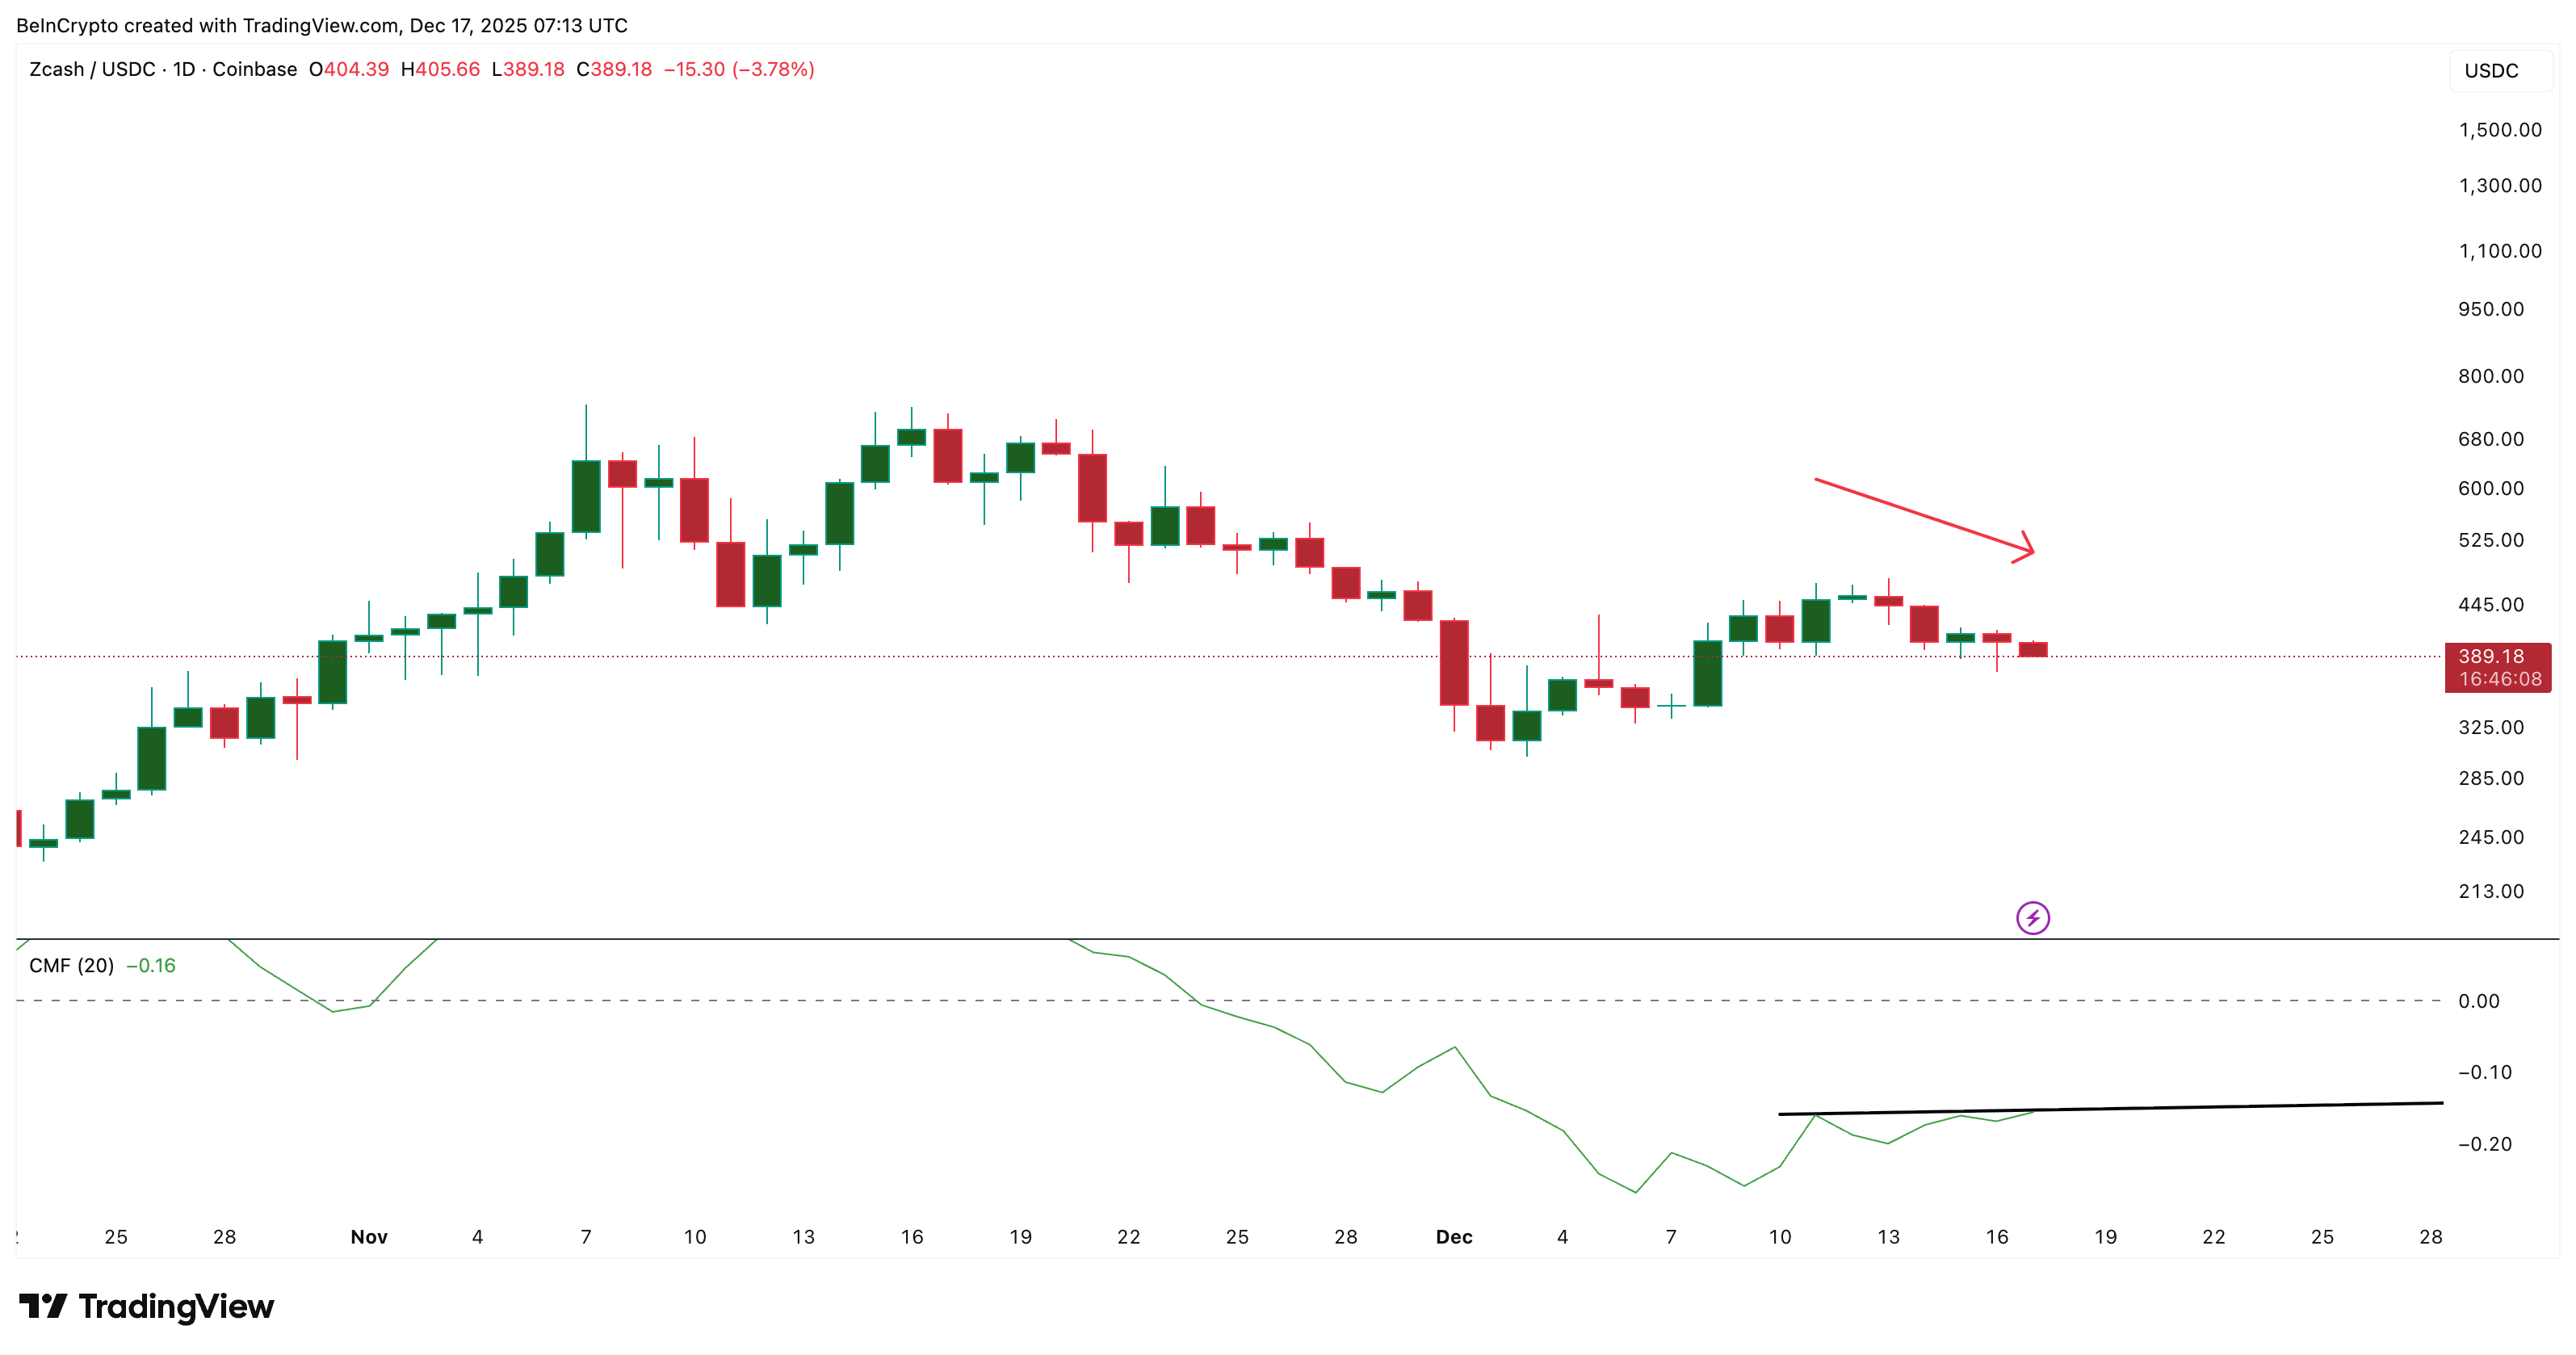 Zcash Sees Improving Capital Flow: TradingView
Want more token insights like this? Sign up for Editor Harsh Notariya’s Daily Crypto Newsletter here.
On-Balance Volume, or OBV, tells a similar cautious story. OBV measures whether volume confirms price moves. In Zcash’s case, OBV continues to move in line with price and has not broken above its descending trend line. There is no bullish divergence here.
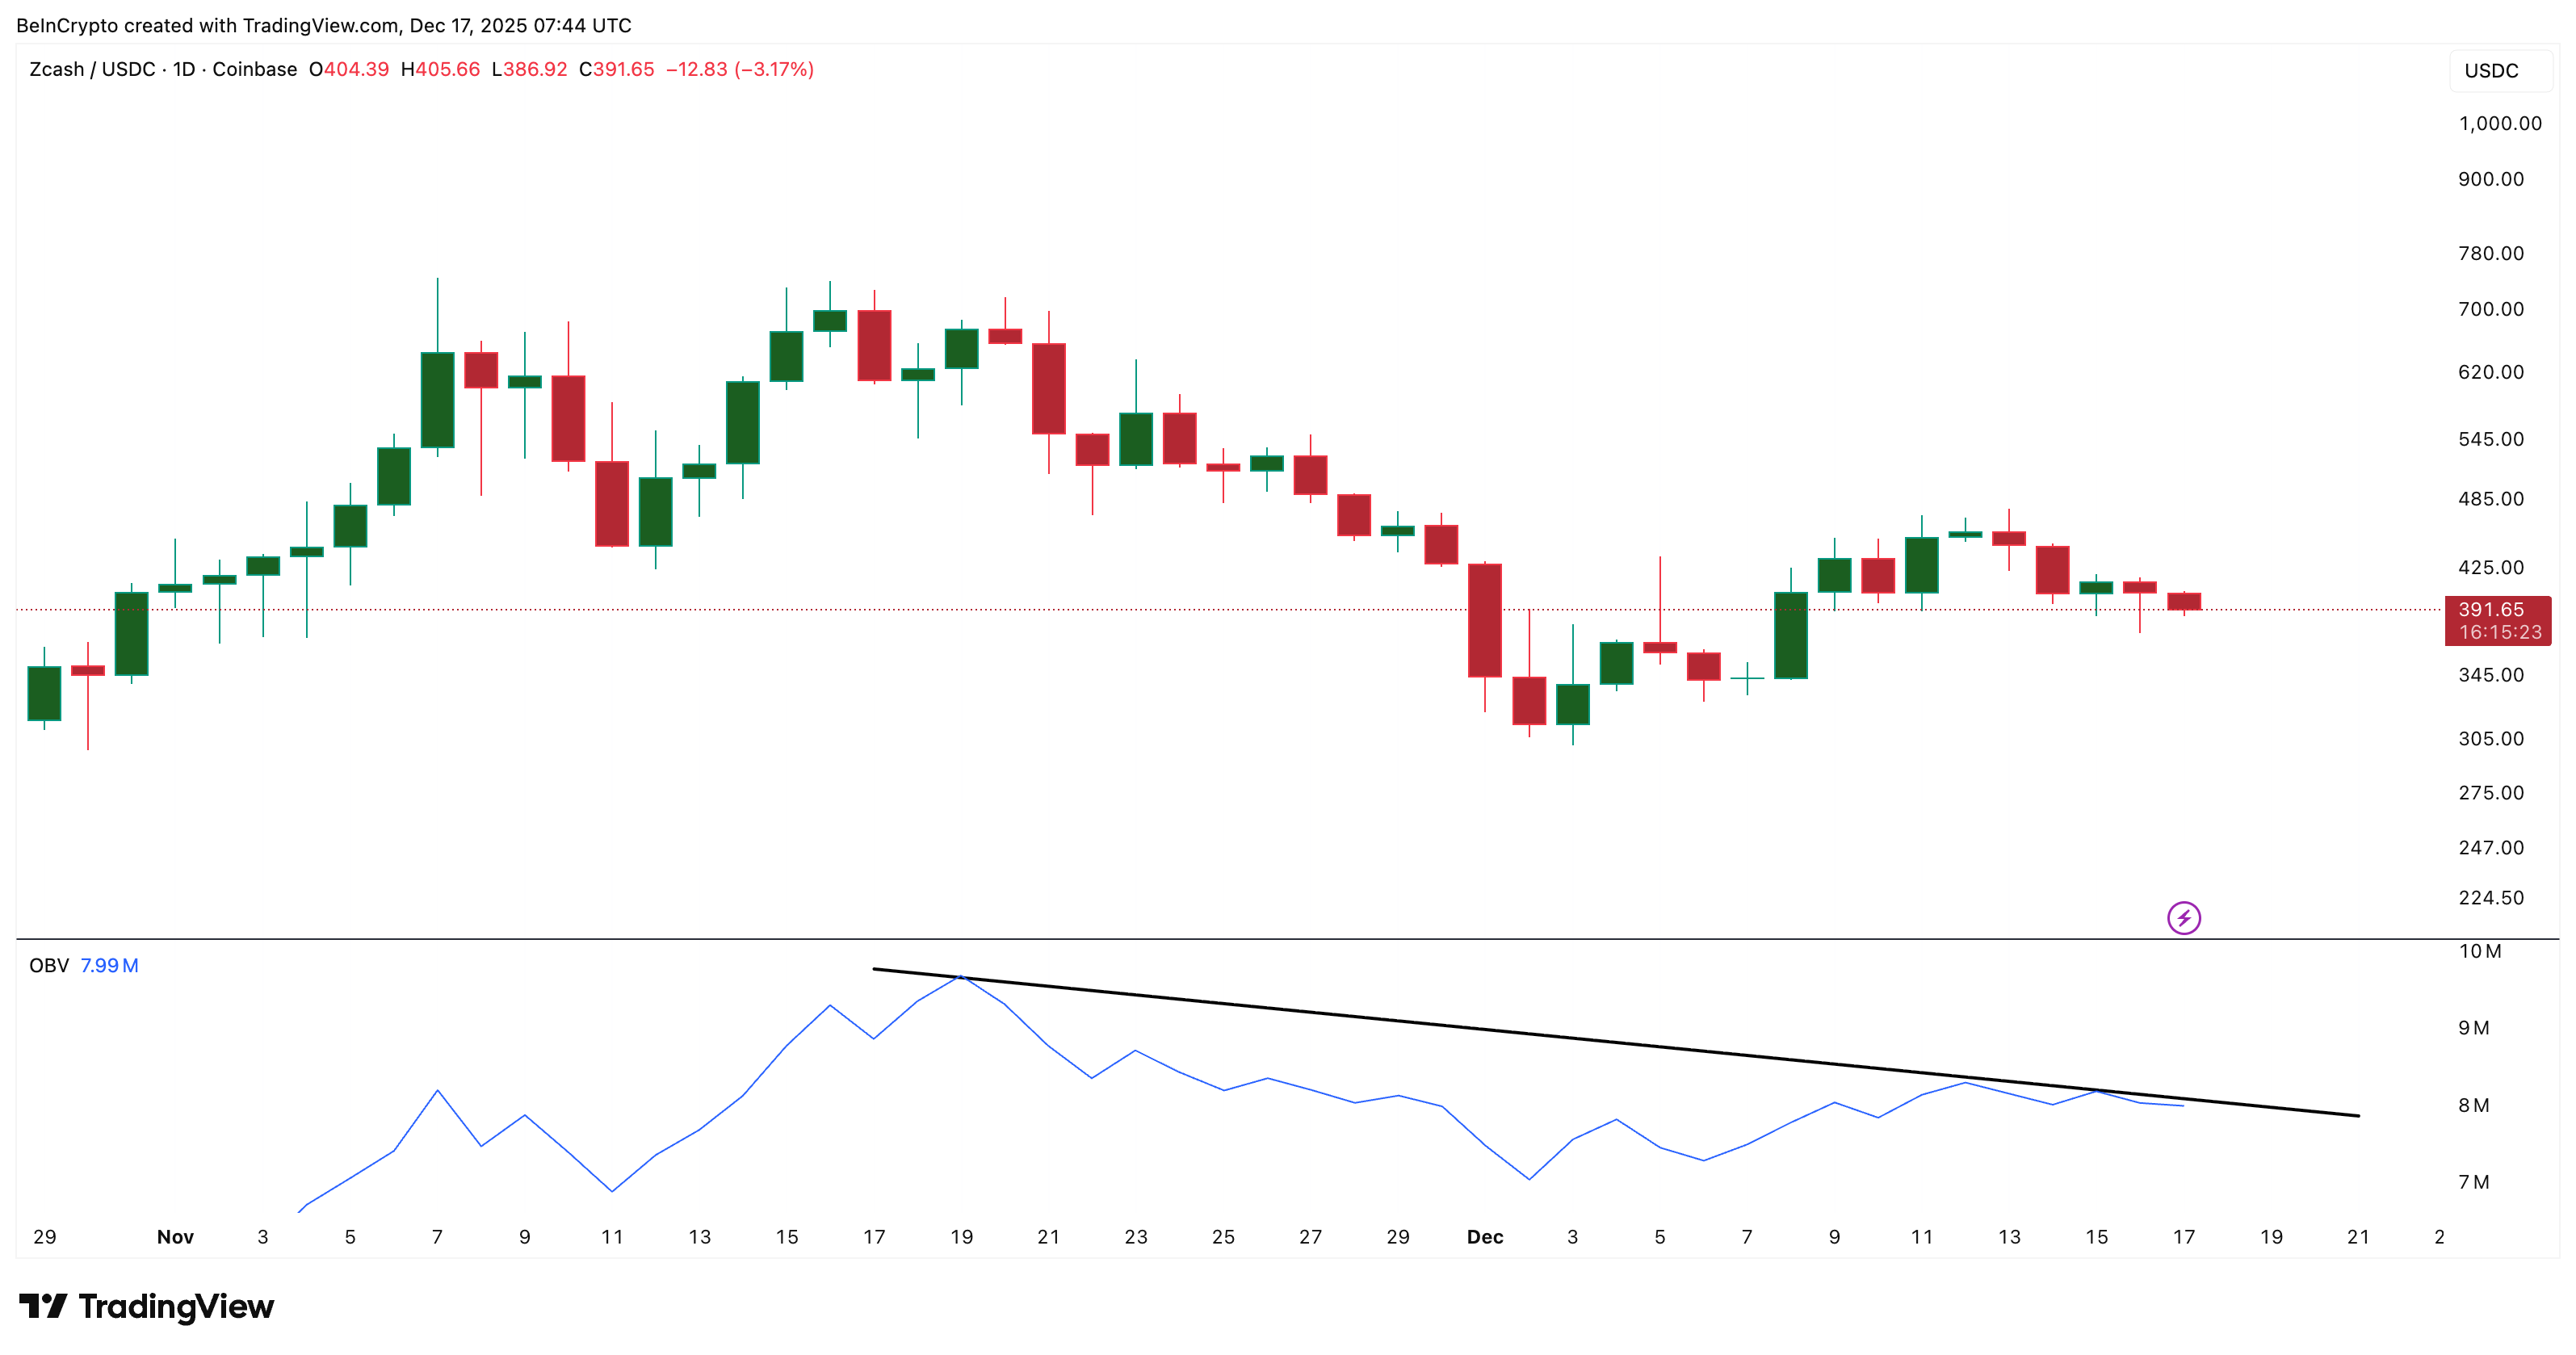 Volume Lacks Confirmation: TradingView
Put simply, some accumulation is happening thanks to the CMF, but it lacks follow-through. This appears to be early positioning, not a full trend shift yet.
Leverage Data Shows a Timing Split Across Traders
Leverage positioning helps explain why the move is slow.
On the seven-day liquidation map, short positions dominate. Shorts total roughly $44 million, while longs sit near $14 million. That shows short-term traders are still positioned for downside. Most are expecting the prices to trend lower.
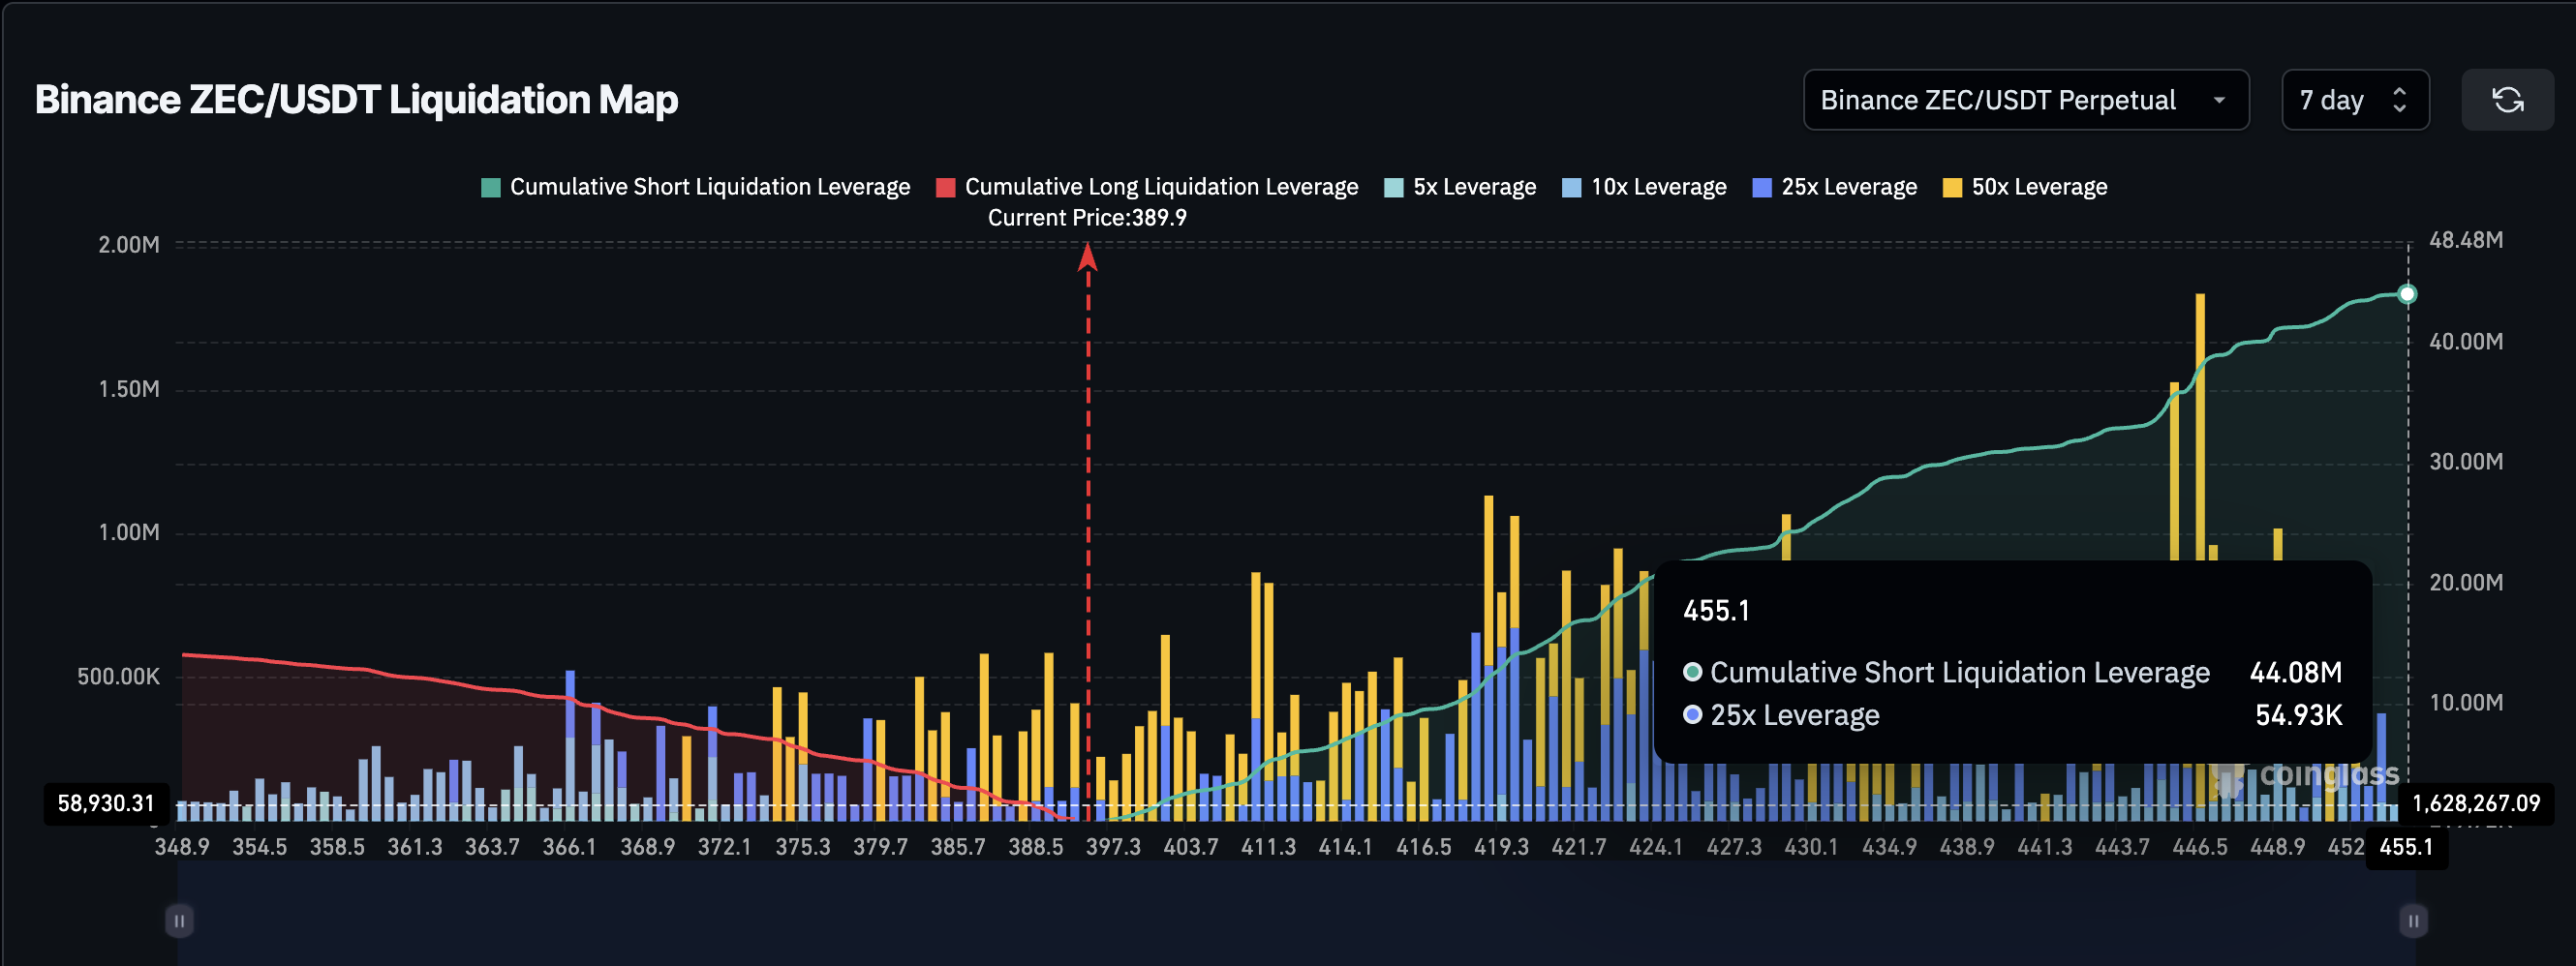 7-Day Liquidation Map: Coinglass
The picture changes on the 30-day view. Long and short leverage both stand near $38 million. That balance suggests longer-term traders are not leaning heavily bearish. Instead, almost half of the derivatives traders are expecting the Zcash price to move up.
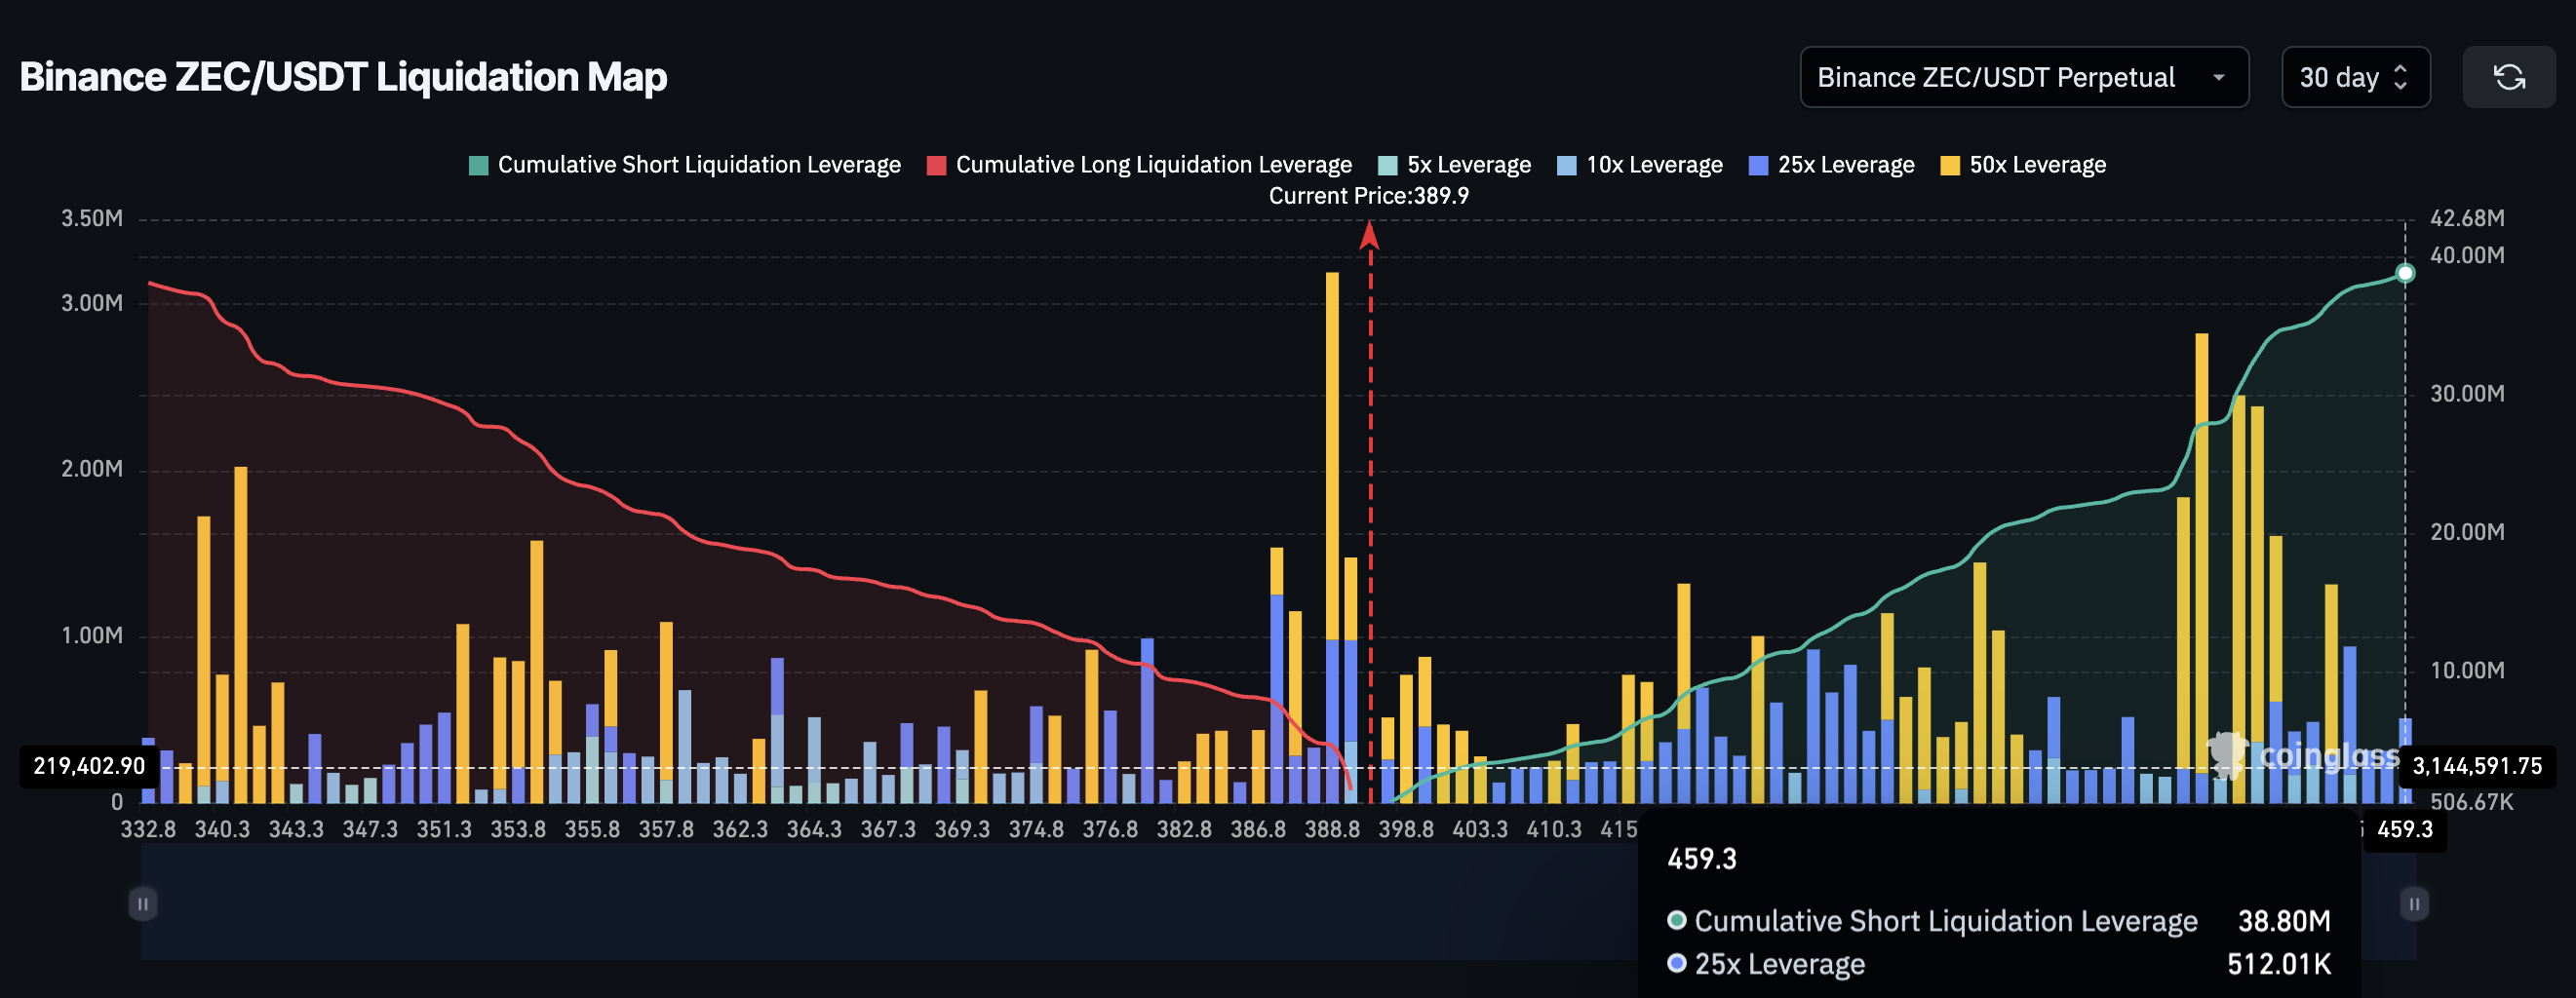 Zcash 30-Day Liquidation Map: Coinglass
This split lines up with the indicator signals. Short-term pressure remains, but longer-term bullish positioning is improving. That is why the move higher for Zcash looks delayed rather than cancelled.
Zcash Price Levels That Decide What Comes Next
Price now ties everything together.
The most important support is $301 if the bearish trend takes over. This level has held multiple tests and marks the lower boundary of the current structure. As long as Zcash stays above $301, the broader uptrend remains intact.
The near-term problem is $404. Zcash has failed to hold above this level and continues to trade below it. That zone now acts as a control point.
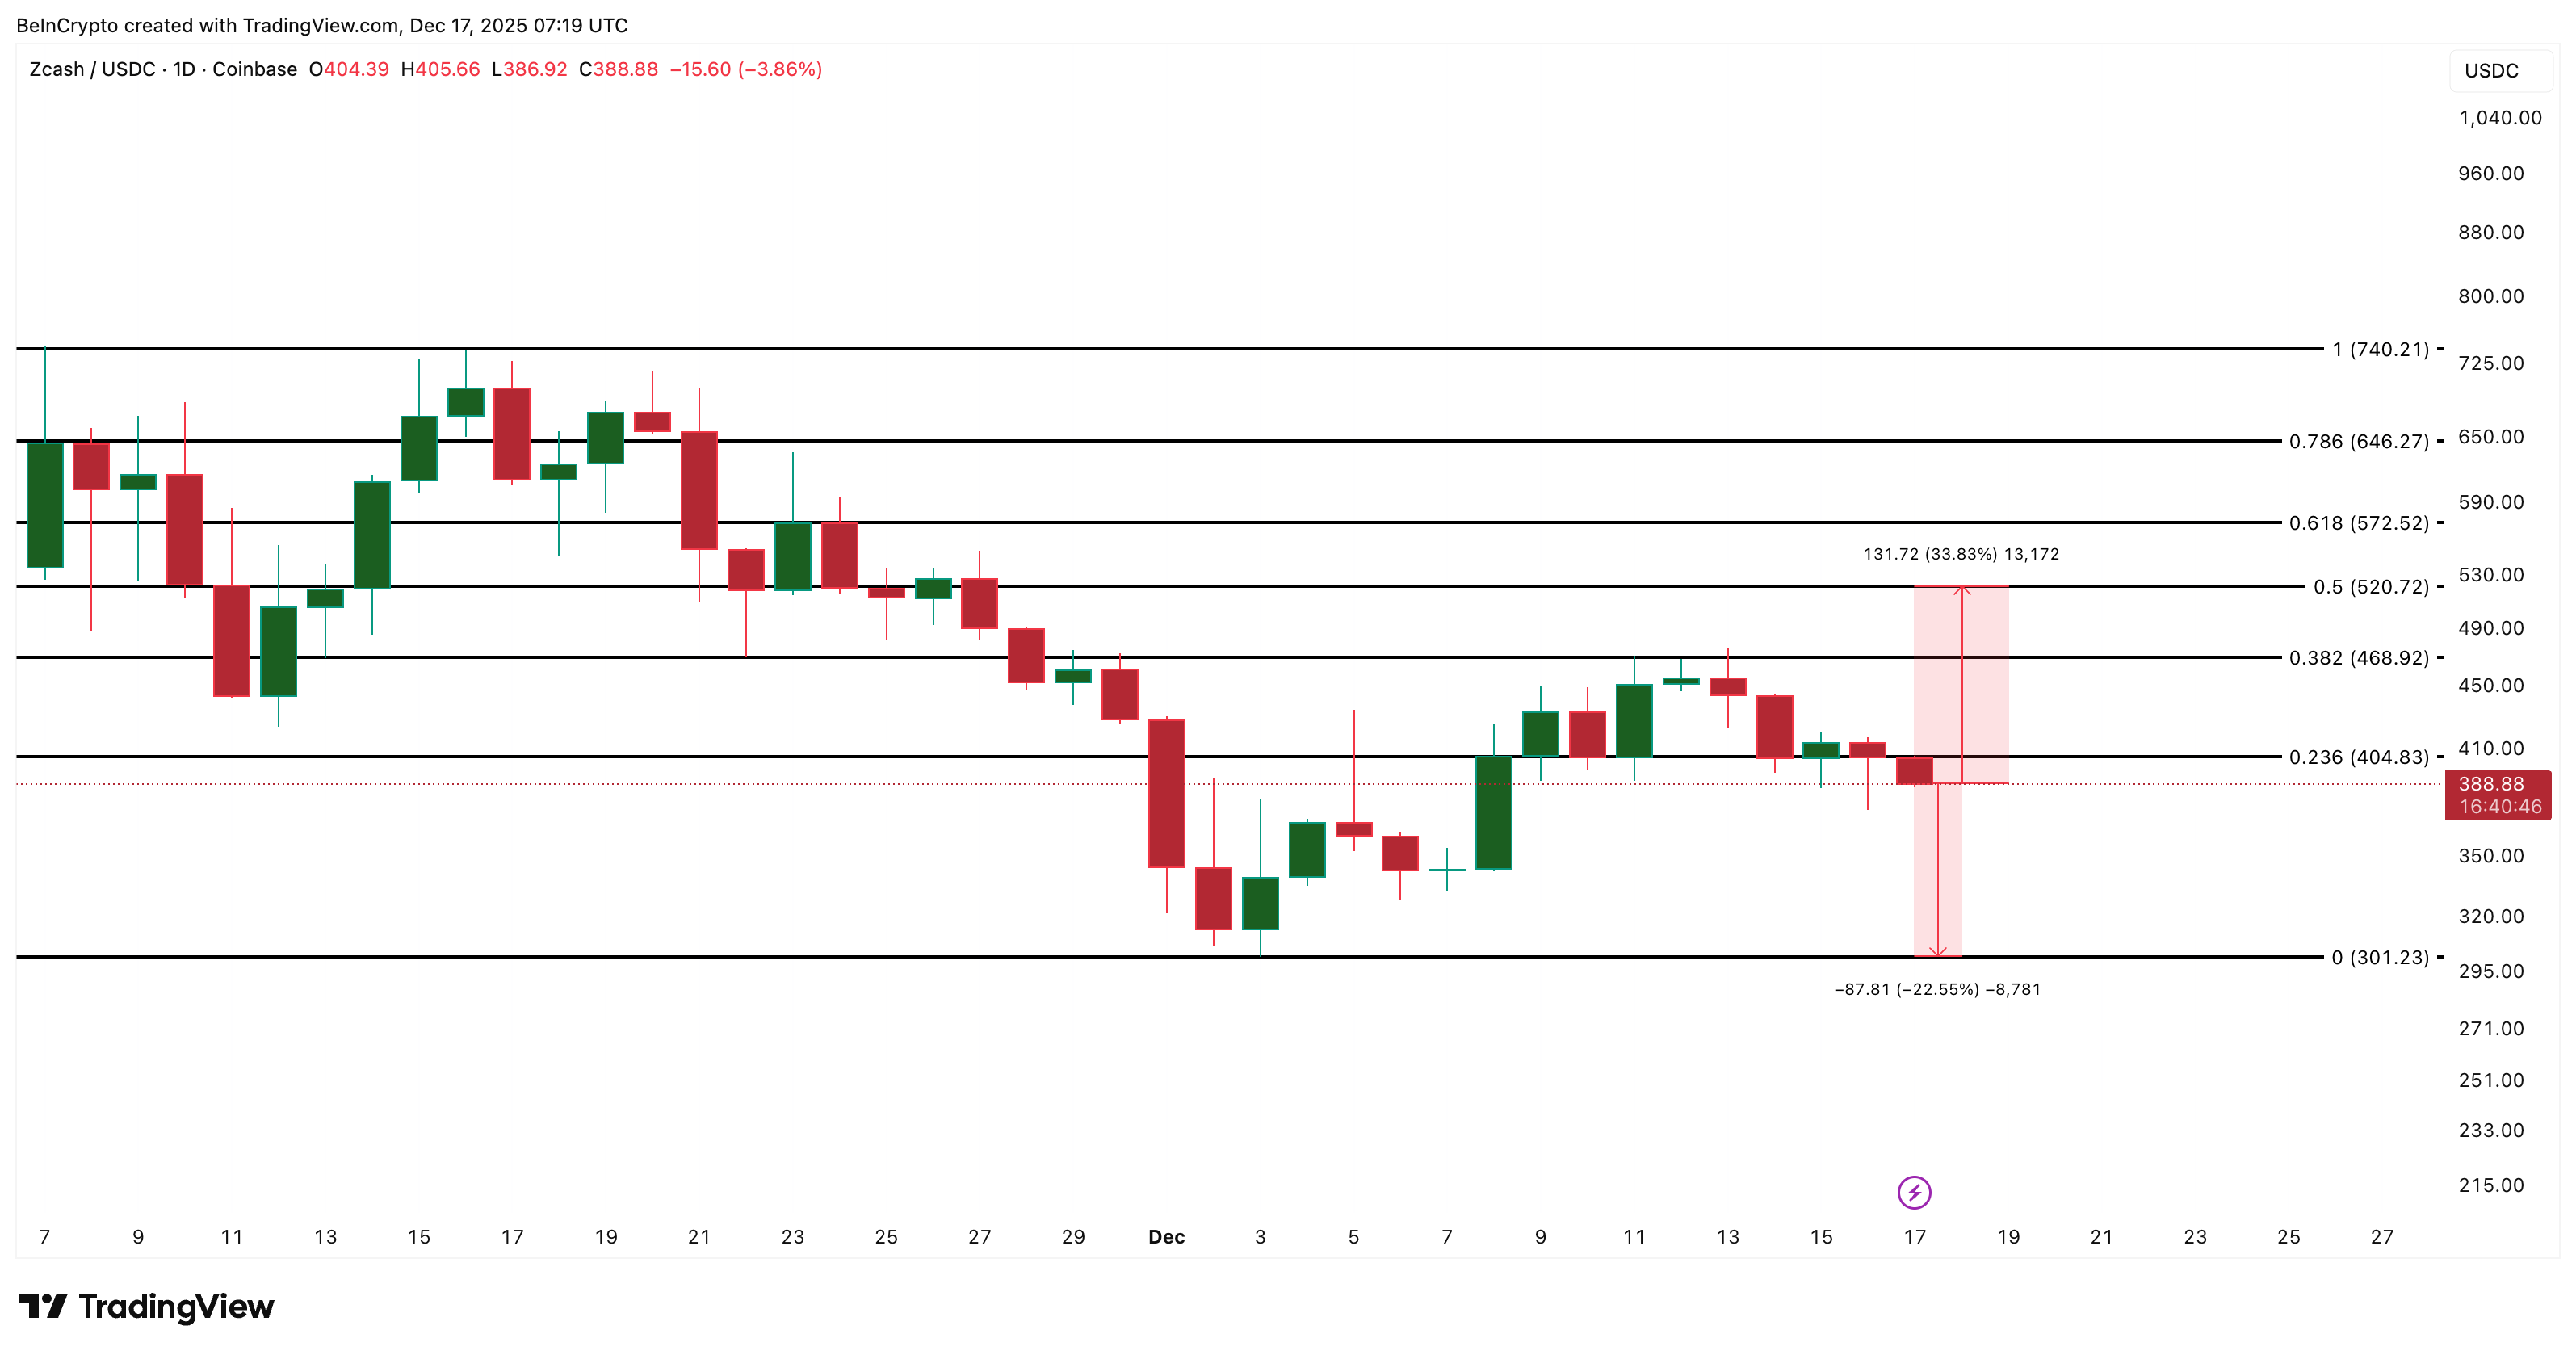 Zcash Price Analysis: TradingView
A daily close above $404 would signal that cautious buyers are gaining confidence. From there, the next major test sits near $520, a level that has capped upside since late November.
If $404 remains unclaimed, downside risk stays open. A loss of $301 would expose deeper pullback risk, even if the longer-term trend survives.
For now, the data points to delay, not defeat. Zcash is waiting for conviction. And that conviction starts with reclaiming $404.
Recommended Articles


