
6 Weeks of Spot ETF Inflows Couldn’t Lift XRP Price — On-Chain Data Explains Why
XRP price is up about 2.3% over the past 24 hours, but the bigger picture remains weak. The token is still down roughly 14% over the past month and about 8.5% over the last seven days.
That weakness stands out because it comes during six straight weeks of spot ETF inflows. On the surface, that looks bullish. In reality, the details explain why the price has stalled.
Six Weeks of ETF Inflows, but Momentum Is Cooling
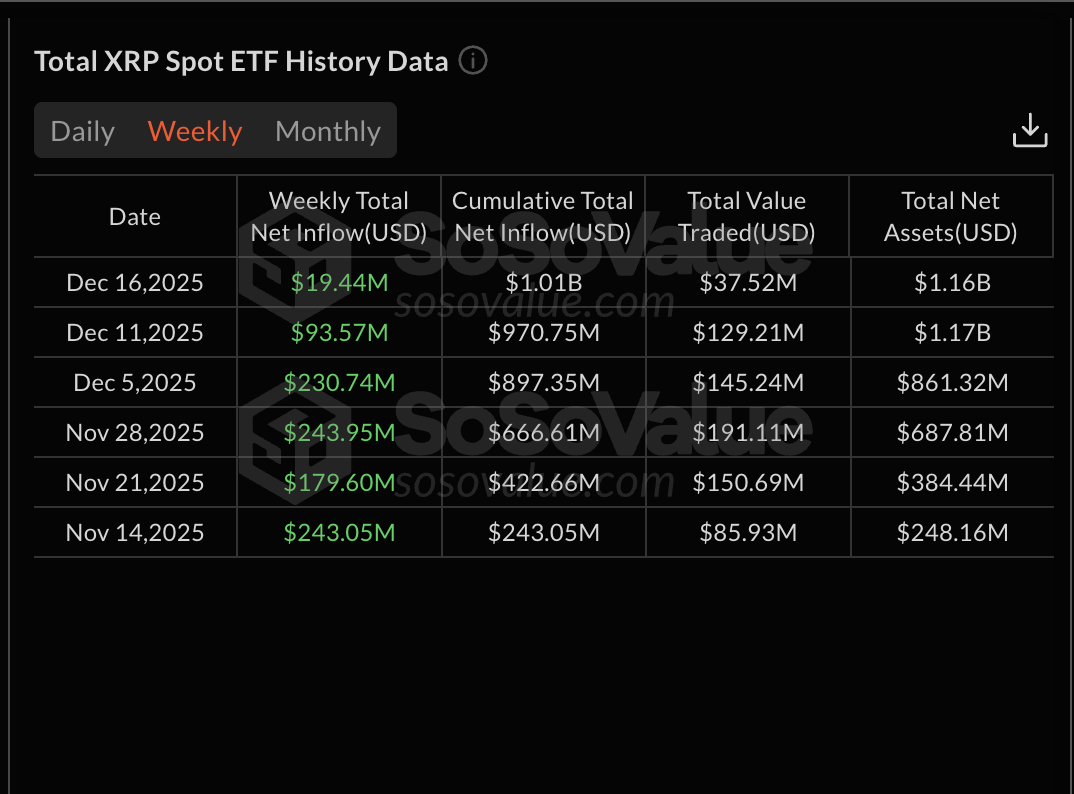
Spot XRP ETFs have now recorded inflows for six consecutive weeks. The run began in mid-November and pushed cumulative net inflows above $1.01 billion.
The strongest demand came early. The week of November 14 saw $243.05 million in net inflows. That was followed by $179.60 million on November 21 and $243.95 million on November 28. Momentum peaked again in early December with $230.74 million during the December 5 week.
 ETF Inflows: SoSo Value
Want more token insights like this? Sign up for Editor Harsh Notariya’s Daily Crypto Newsletter here.
Since then, inflows have cooled sharply. The December 11 week dropped to $93.57 million, and the most recent week ending December 16 added just $19.44 million.
So while the table shows “six weeks of inflows,” the trend underneath is slowing. ETF demand is still positive, but it is no longer accelerating. That cooling helps explain why the XRP price has failed to follow earlier inflow strength higher.
On-Chain Signals Show a Split Between Holder Groups
If ETF demand were cooling but on-chain holders were stepping in aggressively, the price could still stabilize. That has not fully happened.
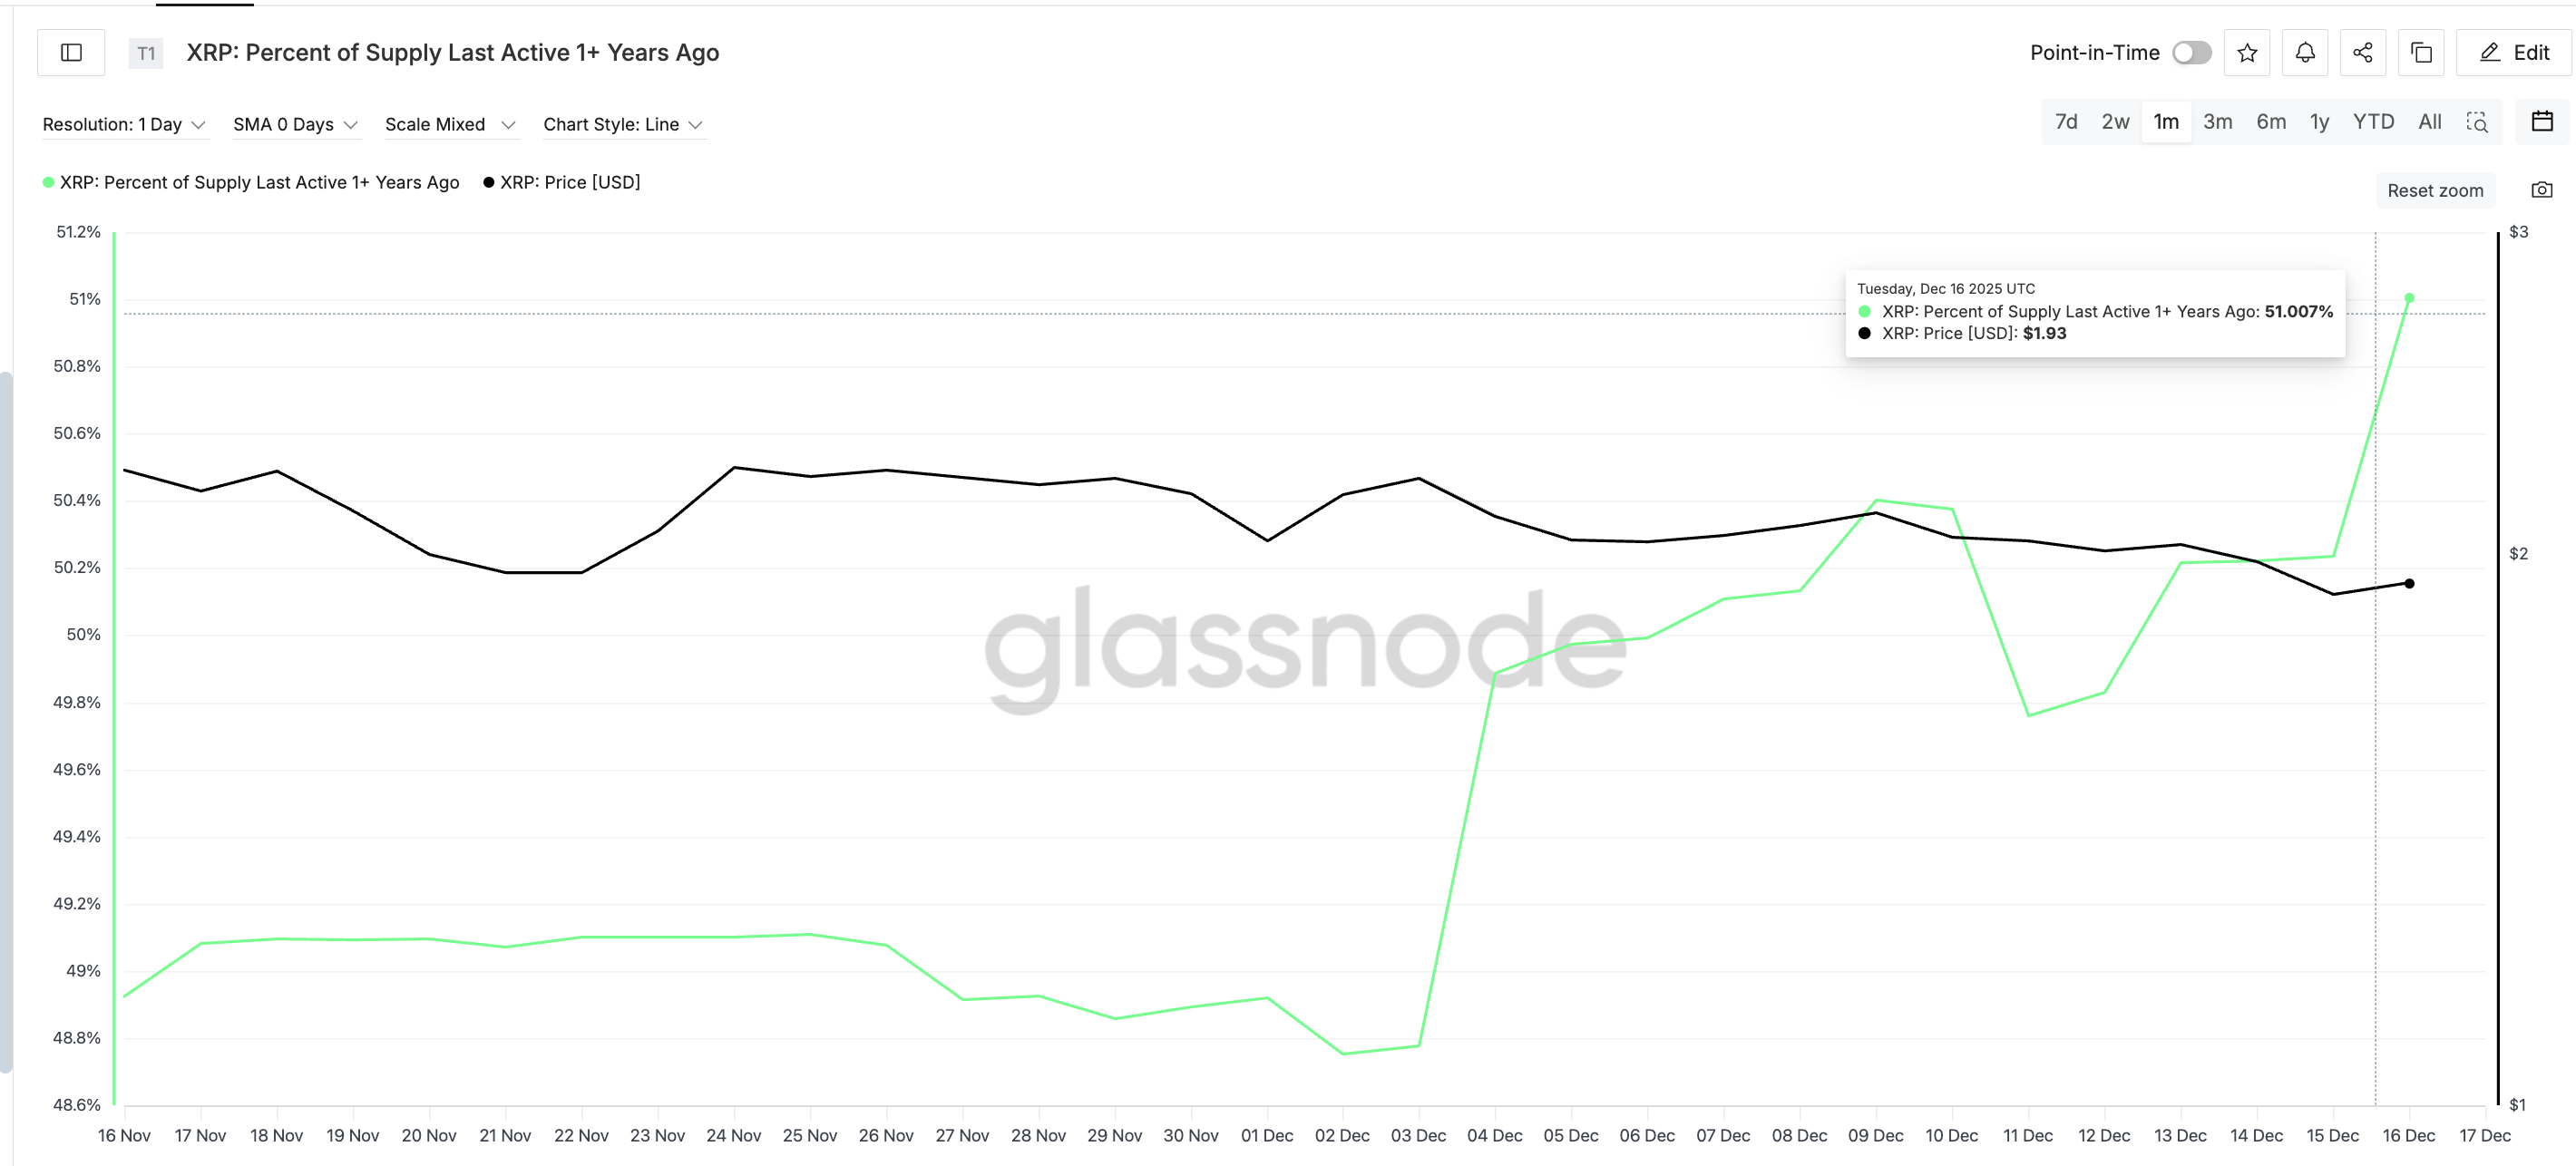
One concerning signal comes from the percent of XRP supply last active more than one year ago. That metric has jumped from 48.75% on December 2 to 51.00%, its highest level in about a month. When older coins start moving, it often means long-held supply is becoming active, which can add sell pressure even without panic.
 XRP Supply Becomes Active: Glassnode
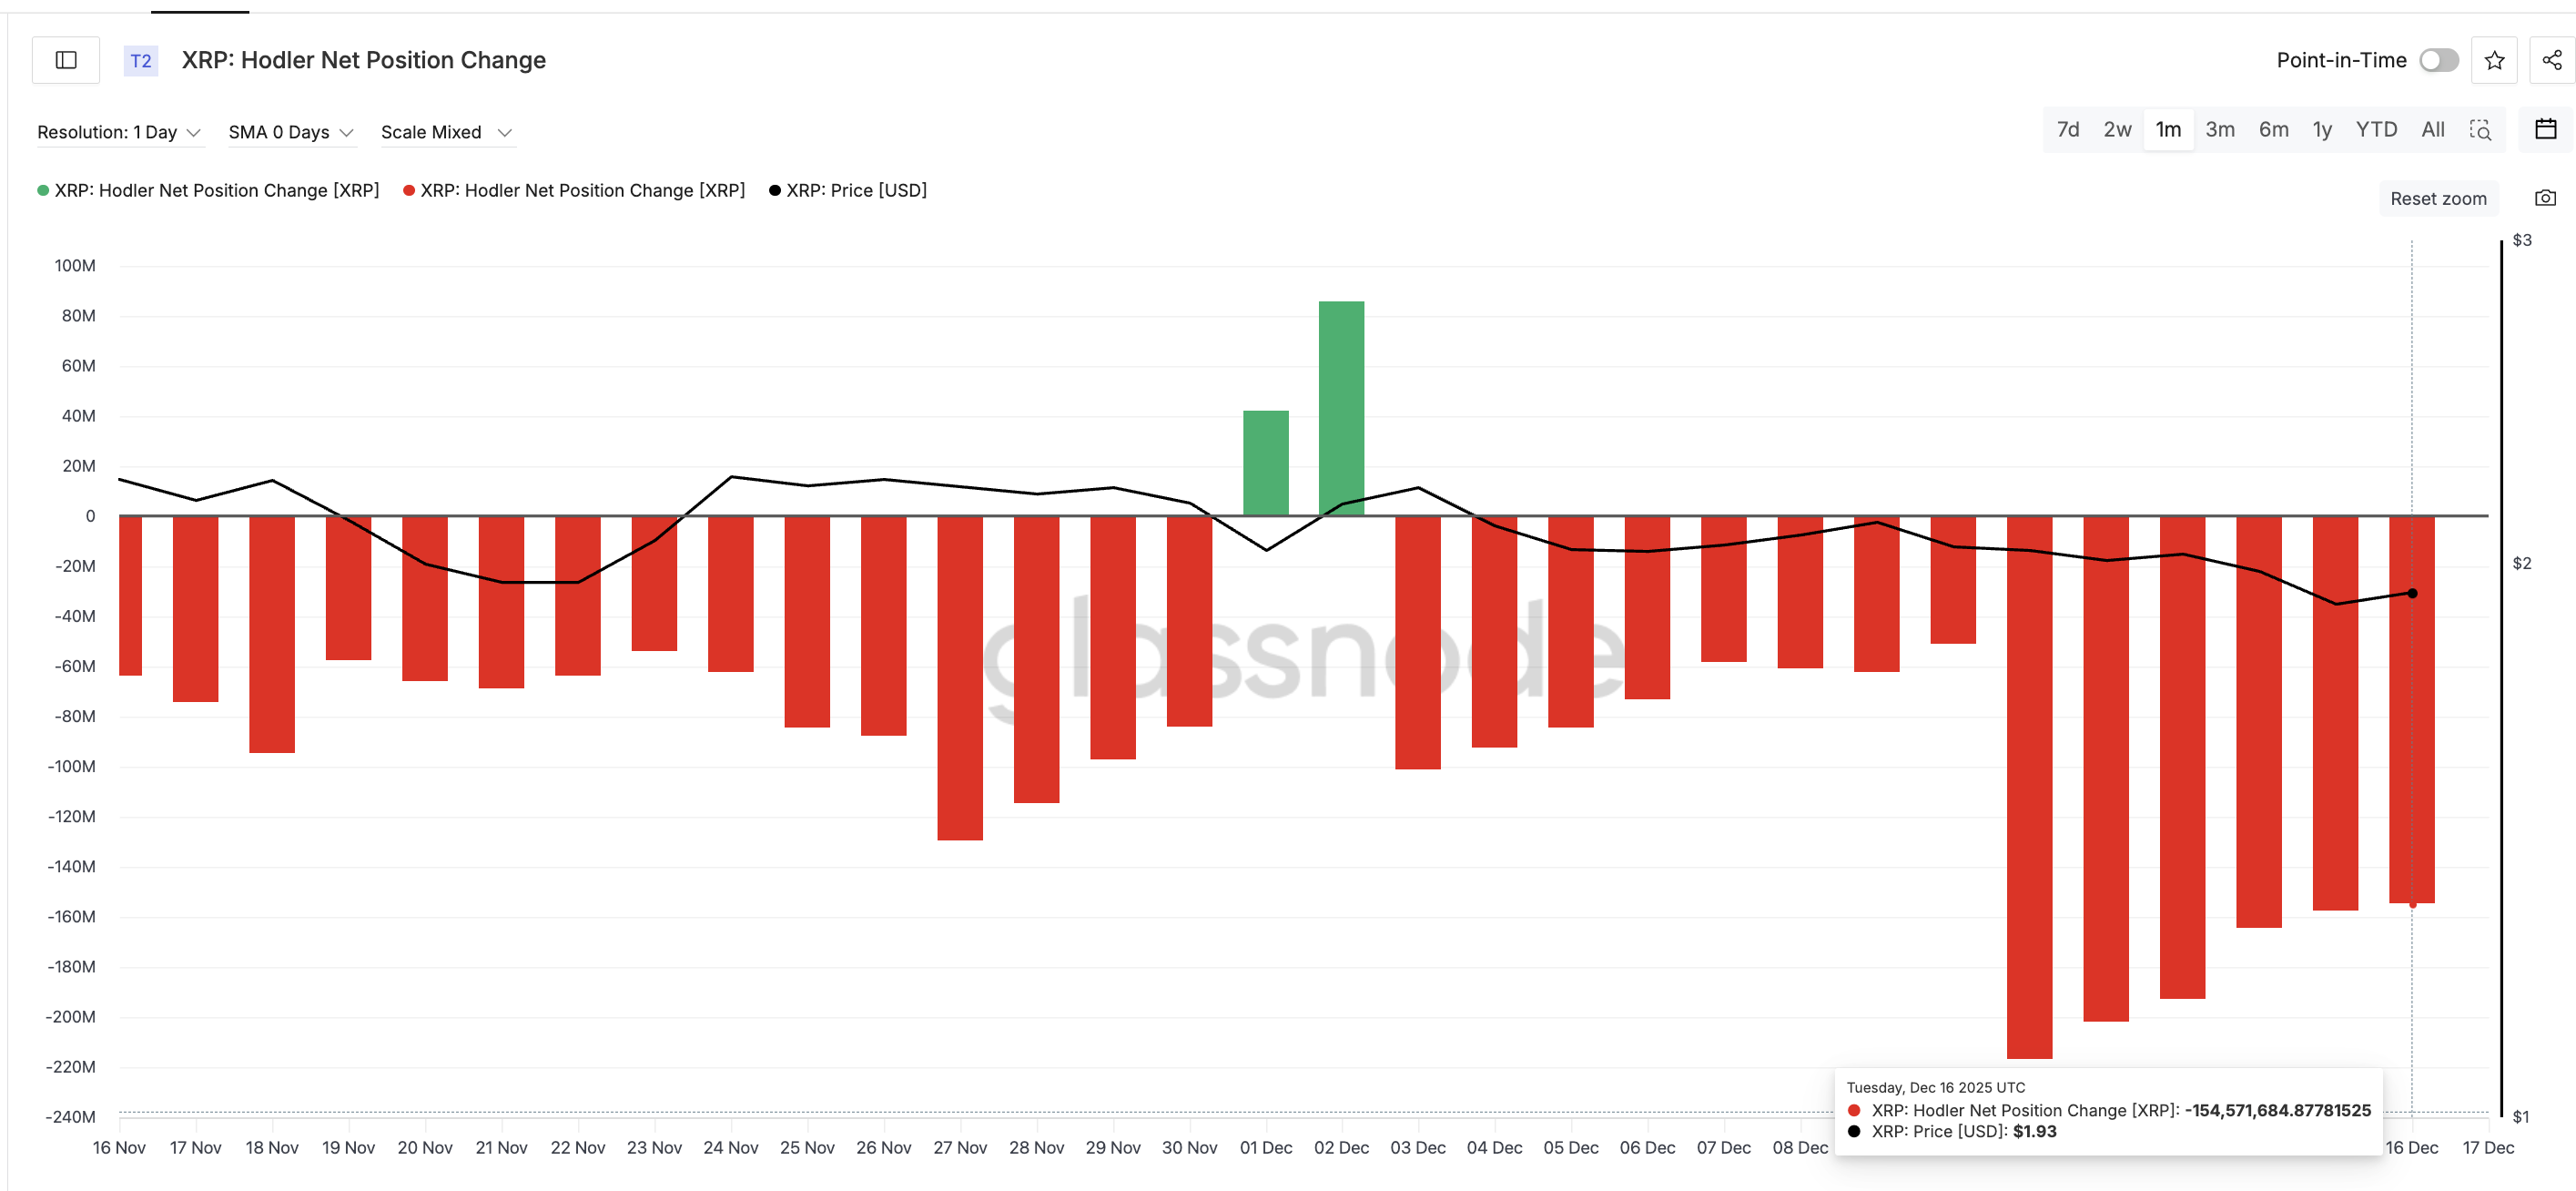
At the same time, another long-term holder group is behaving differently. The Hodler net position change metric for wallets holding XRP longer than 155 days shows selling pressure easing. Net outflows peaked around 216.86 million XRP on December 11, then declined to about 154.57 million XRP by December 16. That is a reduction of roughly 29% in net selling.
 XRP Holders Selling Fewer Coins: Glassnode
This creates a mixed picture. Some long-term supply is waking up, which is bearish. But some of those holders are selling less, which has helped the XRP price avoid a sharp breakdown, yet. However, one theory could be that the coin movement has happened, and these holders are waiting to sell into price bounces.
Unless the Hodler net position change metric flips green (net buying), the XRP price bounces might not hold.
XRP Price Levels Decide Whether the Stall Turns Into a Drop
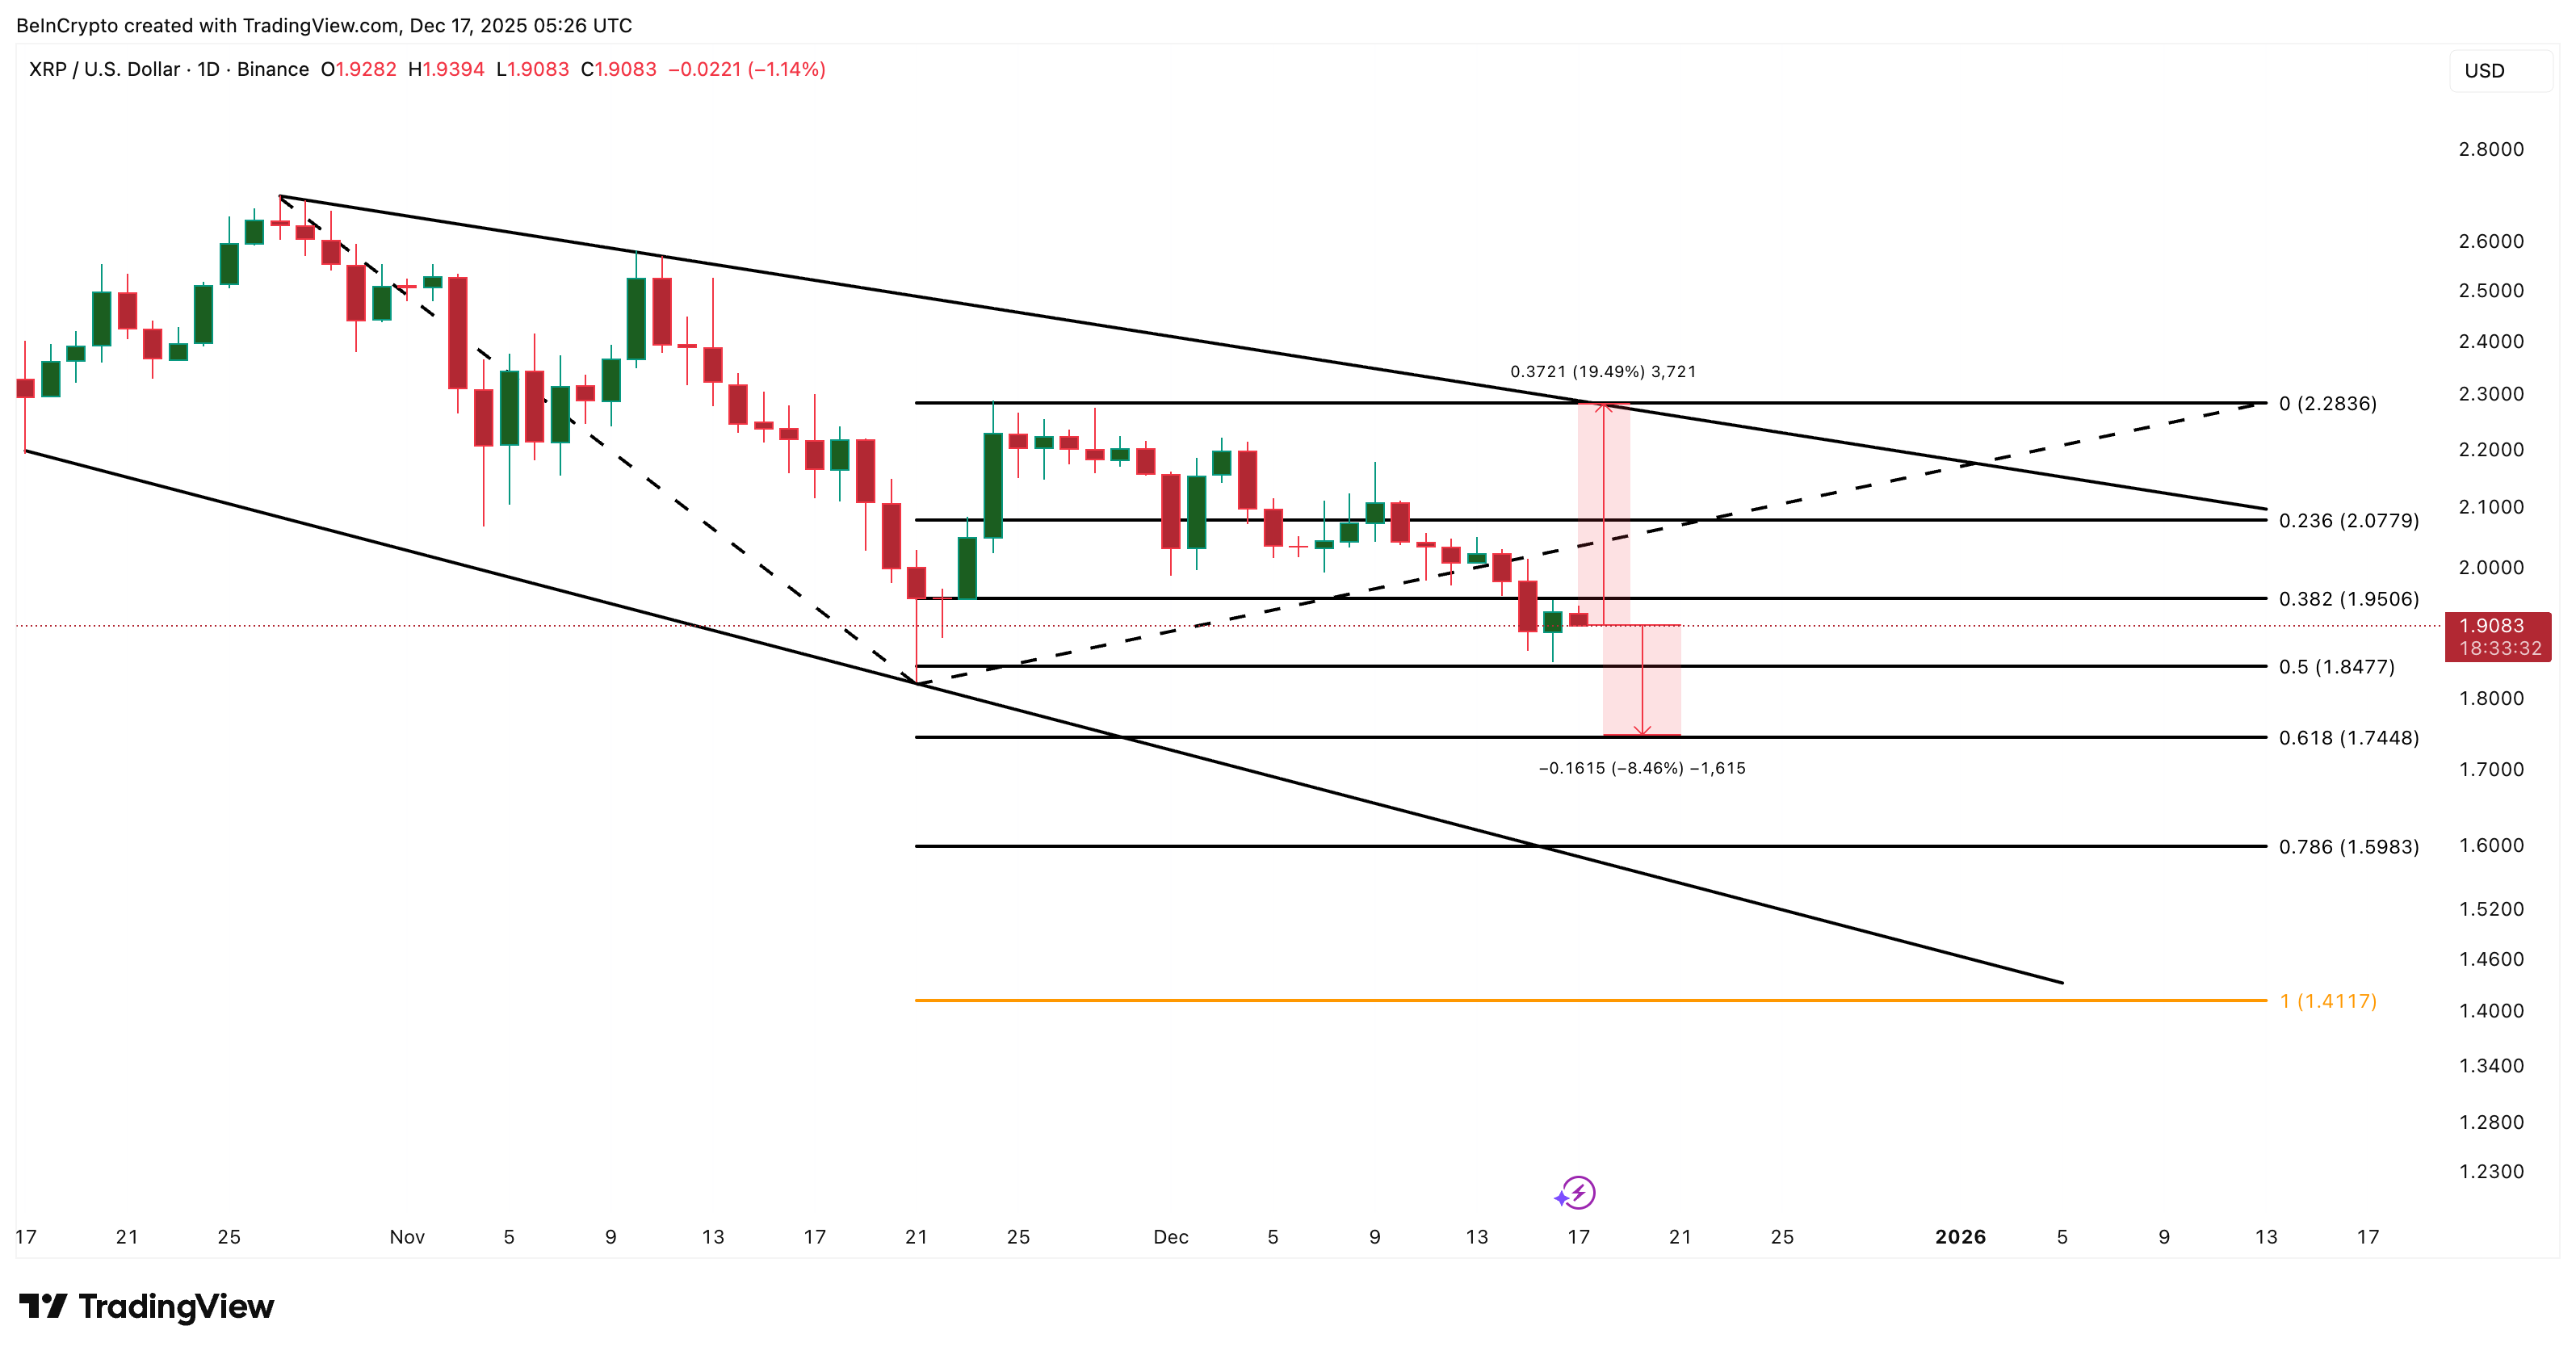
Price action reflects this balance. The XRP price is trading inside a falling wedge and remains stuck in the middle of its recent range.
For bulls, the level that matters is $2.28. A daily close above it would break the wedge and imply roughly a 19% upside from current levels, shifting momentum back toward buyers.
Downside risk remains more immediate. If XRP loses $1.74, the 0.618 Fibonacci level, the chart opens toward $1.59, with a deeper extension near $1.41 if broader market weakness continues.
 XRP Price Analysis: TradingView
Right now, ETF inflows alone are not enough. With demand cooling and on-chain signals split, XRP price remains stuck between support holding and sellers slowly regaining control.
Recommended Articles


