Dogecoin Price Forecast: DOGE at key support flashes mixed technical signals

Source Fxstreet
  • Dogecoin is up almost 2% on Monday from the $0.1332 support level of a consolidation range, a potential rebound is likely.
  • Derivatives data show an increase in bullish bets and Open Interest, indicating renewed risk-on sentiment.
  • The technical outlook for DOGE remains mixed, as the MACD indicator signals a potential bearish crossover.

Dogecoin (DOGE) edges higher by nearly 2% at press time on Monday, recovering from a 3.57% loss on the previous day. The meme coin risks falling out of a consolidation range amid weak institutional demand and declining bullish momentum. However, the derivatives market sees a surge in bullish bets as traders anticipate a potential rebound, increasing the capital exposure in DOGE futures.

Retail demand strengthens for DOGE, overlooking long liquidations

CoinGlass data shows that the Dogecoin futures Open Interest (OI) has increased by 4.88% in the last 24 hours, to $1.49 billion. This indicates an increase in the notional value of active derivatives contracts, possibly due to increased capital or leverage exposure. 

However, the long liquidations of $3.33 million in the last 24 hours outpace the short liquidations of $799,590, indicating a sell-side dominance.

DOGE derivatives data. Source: CoinGlass

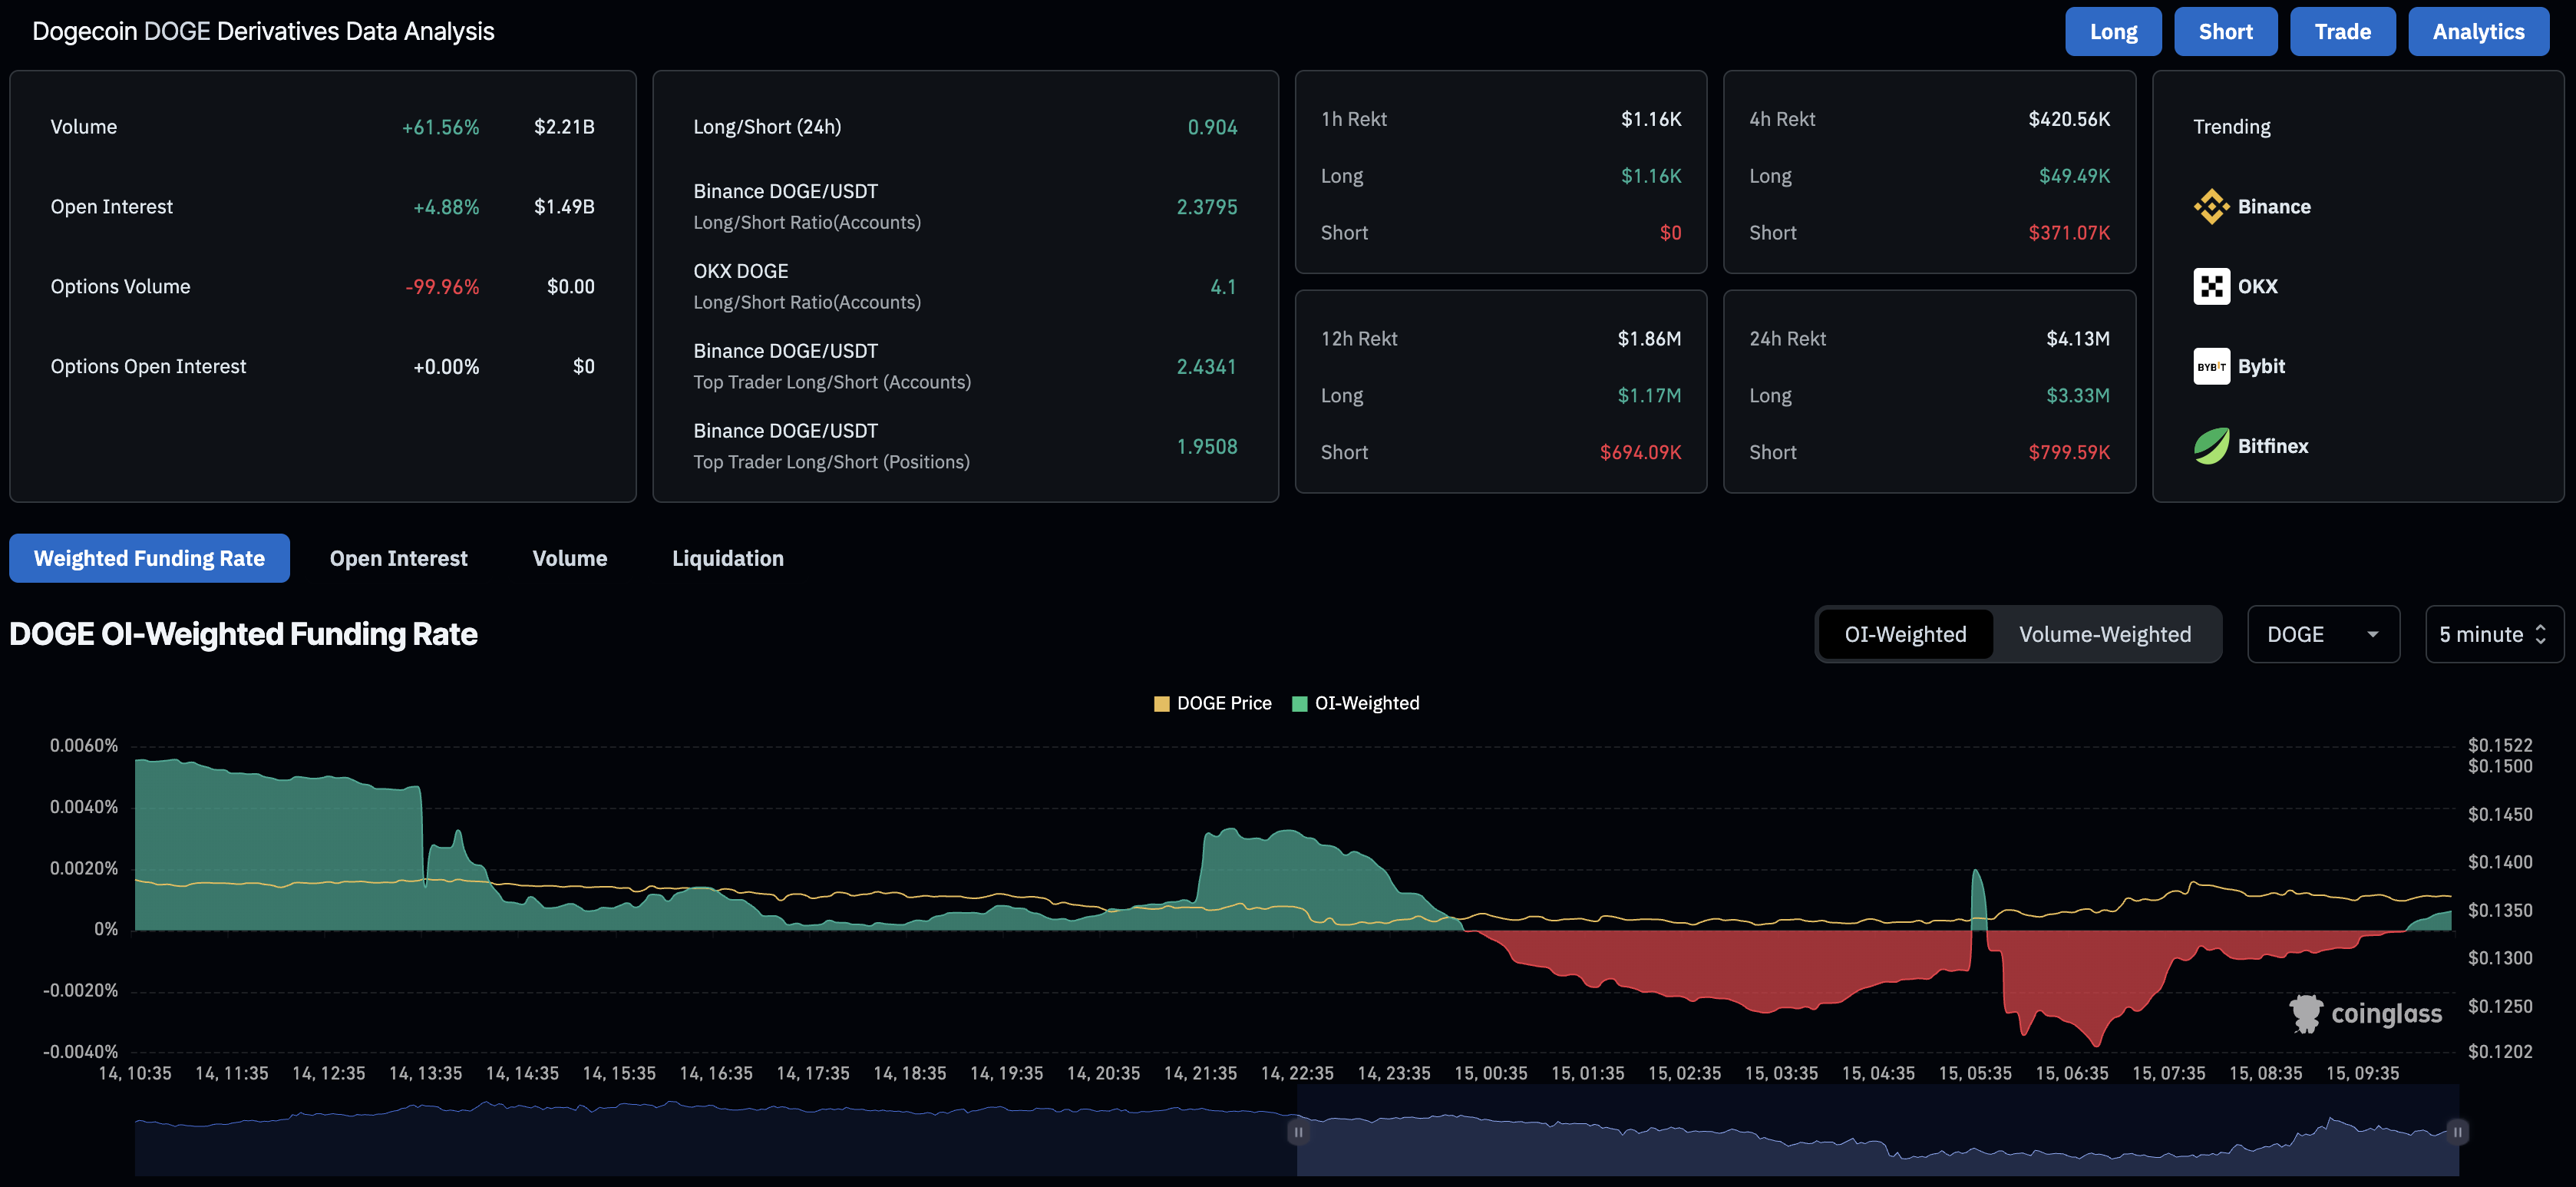
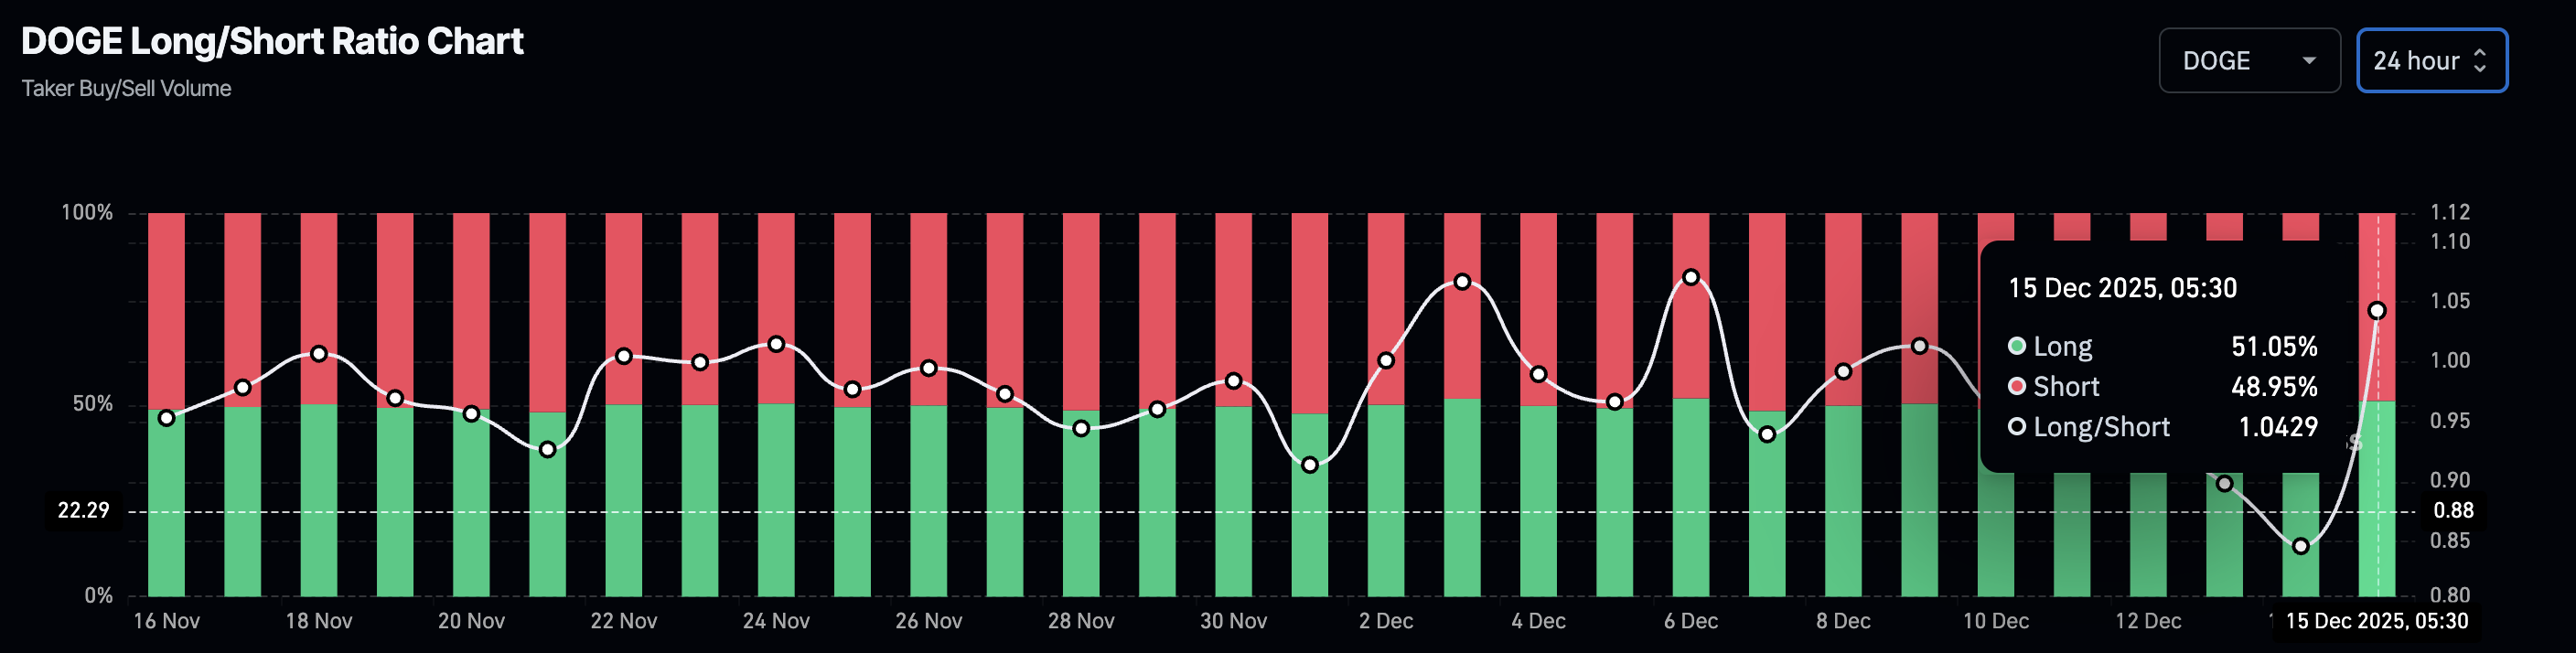
Still, the long-to-short ratio chart shows an increase in long positions to 51.05% on Monday, from 45.83% on Sunday, indicating a steady rise in bullish confidence. 

DOGE long/short ratio chart.

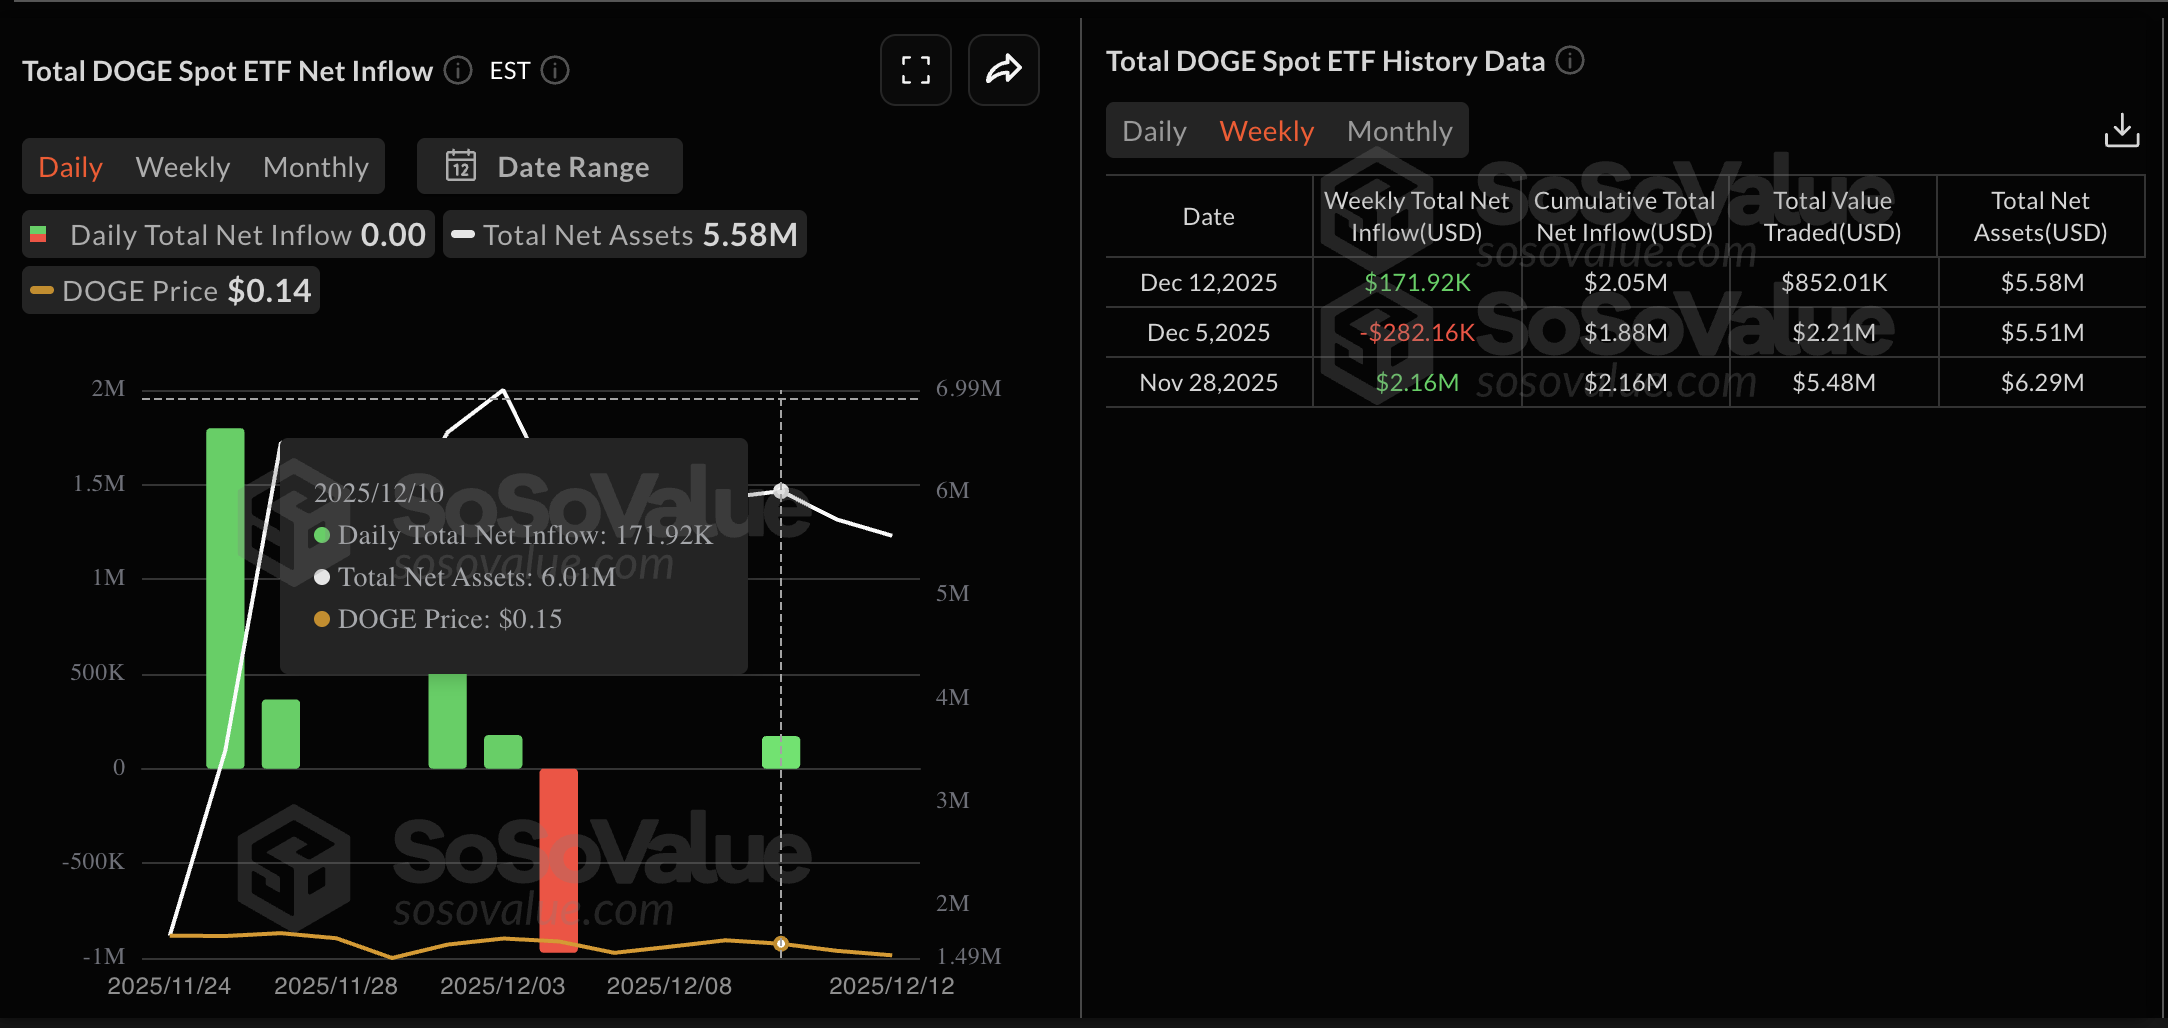
On the institutional side, the Sosovalue data shows that the Dogecoin ETFs recorded $171,920 in inflows last week. The inflow occurred on Wednesday, while the remaining days were recorded as net-zero flows, signaling reduced institutional interest in the meme coin.

DOGE ETFs data. Source: Sosovalue

Dogecoin’s consolidation at risk as buying pressure wanes

Dogecoin trades in a consolidation range extending between the November 21 low at $0.13321 and the November 26 high at $0.15681. At the time of writing, DOGE struggles to hold ground around the support level with a nearly 2% rise on Monday.

A potential rebound in the meme coin could target the overhead resistance at $0.15681, followed by the R1 Pivot Point at $0.17882, if it breaks free from the mentioned range.

However, the momentum indicators on the daily chart signal a loss in bullish momentum. The Relative Strength Index (RSI) at 40 steadies a lateral trend between the midpoint line and the oversold boundary, reflecting a bearish bias.

Meanwhile, the Moving Average Convergence Divergence (MACD) approaches its signal line, risking a crossover that would confirm a bearish trend in DOGE. 

DOGE/USDT daily price chart.

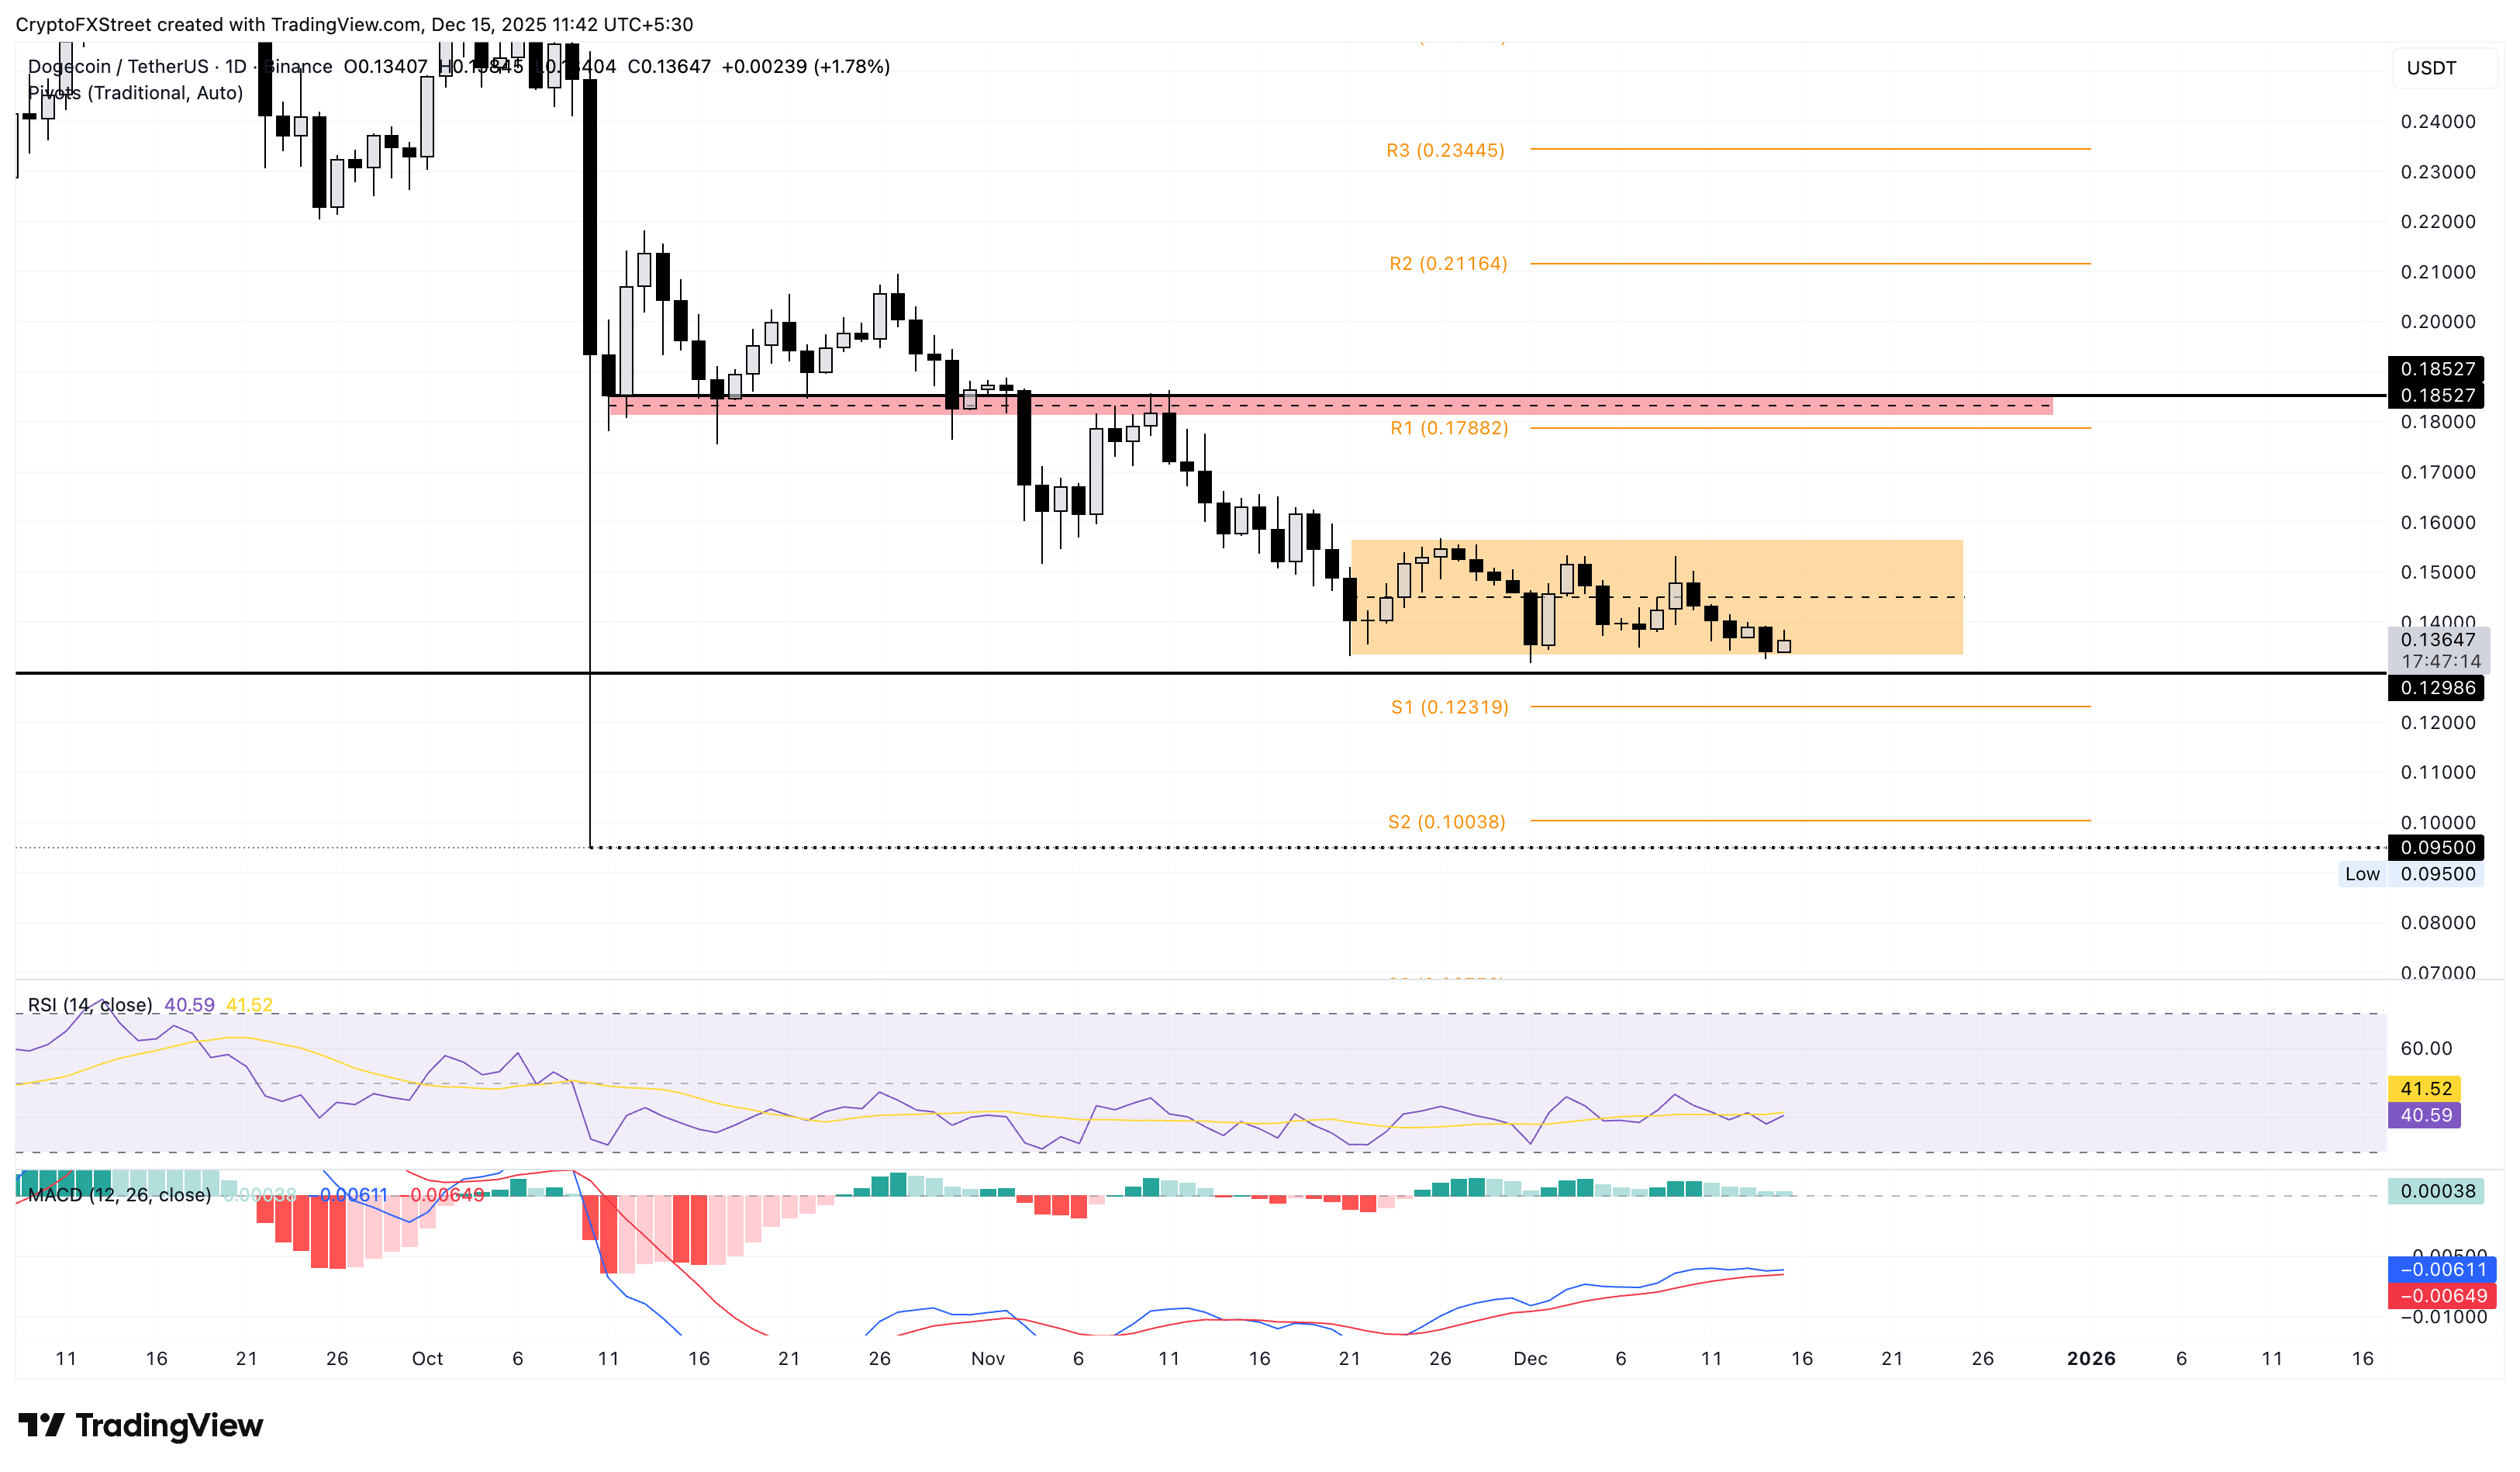
If DOGE clears below the $0.13321 support, it could threaten a decline below April’s low at $0.12986, targeting the S1 Pivot Point at $0.12319.

Disclaimer: For information purposes only. Past performance is not indicative of future results.
placeholder
Ethereum (ETH) Price Closes Above $3,900 — Is a New All-Time High Possible Before 2024 Ends?Once again, the price of Ethereum (ETH) has risen above $3,900. This bounce has hinted at a further price increase for the altcoin before the end of the year.
Author  Beincrypto
Dec 17, 2024
Once again, the price of Ethereum (ETH) has risen above $3,900. This bounce has hinted at a further price increase for the altcoin before the end of the year.
placeholder
Ethereum slides below $3,000 as sellers defend $3,020 and $2,880 becomes the key lineEthereum fell below $3,000 after failing at $3,200, with resistance at $3,020 and key support at $2,880; a break lower could target $2,800 and $2,750, while a rebound needs $3,120–$3,150.
Author  Mitrade
Jan 21, Wed
Ethereum fell below $3,000 after failing at $3,200, with resistance at $3,020 and key support at $2,880; a break lower could target $2,800 and $2,750, while a rebound needs $3,120–$3,150.
placeholder
Bitcoin’s Whale Map Shifts as BTC Drops Below $90,000Bitcoin fell below $90,000 to around $88,300 as risk-off headlines hit markets, while on-chain data shows new whales now lead Realized Cap with a ~$98,000 cost basis and ~$6B unrealized losses.
Author  Mitrade
Jan 22, Thu
Bitcoin fell below $90,000 to around $88,300 as risk-off headlines hit markets, while on-chain data shows new whales now lead Realized Cap with a ~$98,000 cost basis and ~$6B unrealized losses.
placeholder
Gold moves away from record high as safe-haven demand fades on easing trade war concernsGold (XAU/USD) is seen extending the previous day's modest pullback from the vicinity of the $4,900 mark, or a fresh all-time peak, and drifting lower through the Asian session on Thursday.
Author  FXStreet
Jan 22, Thu
Gold (XAU/USD) is seen extending the previous day's modest pullback from the vicinity of the $4,900 mark, or a fresh all-time peak, and drifting lower through the Asian session on Thursday.
placeholder
Top 3 Price Forecast: BTC Shows Early Stabilization; ETH and XRP Still Look HeavyBTC trades near $89,900 after holding $87,787 support and eyeing the $91,942 50-day EMA, while ETH (~$2,964) remains capped below $3,017 and XRP (~$1.91) keeps downside risk toward $1.77 after failing to reclaim key levels.
Author  Mitrade
Yesterday 05: 56
BTC trades near $89,900 after holding $87,787 support and eyeing the $91,942 50-day EMA, while ETH (~$2,964) remains capped below $3,017 and XRP (~$1.91) keeps downside risk toward $1.77 after failing to reclaim key levels.
Related Instrument
goTop
quote