Dogecoin price could make a 15% recovery as DOGE market attempts to determine a bottom

Source Fxstreet
  • Dogecoin price dipped nearly 15% after the Friday crypto market bloodbath.
  • DOGE could make a 15% recovery if Bitcoin price shows strength again.
  • While a slip below $0.1606 would negate the thesis, the hammer candle is a caveat.

Dogecoin (DOGE) price led the meme coin sector dip as markets followed the Bitcoin (BTC) price south in the Friday bloodbath. With markets still in a state of optimism ahead of the BTC halving, the correction could give traders a chance to buy DOGE at a discount ahead of the anticipated event.

Also Read: Doge contributor warns of extreme volatility amid Coinbase listing of DOGE and PEPE futures products

Dogecoin price attempts bottom determination

Dogecoin price is down by nearly 15% in the wreckage of the Bitcoin price dump. With it, altcoins and meme coins in particular are down significantly, some as deep as -20% in losses. However, the dump has not reversed the cryptocurrency market sentiment as the second quarter (Q2) of 2024 catches steam. With all eyes peeled on the having, the sector has much to look forward to in the next seven days and then the next several months after that.

Meanwhile, Dogecoin price remains above a crucial support level, demarcated by the ascending trendline. With this support threshold providing a notable buying opportunity twice before, it could be the jumping-off point for DOGE, especially with a hammer candle in play.

For the layperson, a hammer candle is a bullish reversal pattern characterized by a small body at the top of the candle and a long lower shadow or wick resembling a hammer. It manifests when the asset’s price has been dropping, with its appearance showing that particular market is attempting to determine a bottom with sellers capitulating.

It also suggests that buyers are starting to step in and push the price back up. This can be a signal for traders to consider going long or buying the asset. Accentuating this bullish technical formation with the Relative Strength Index (RSI) outlook supports the bullish thesis. Notice the RSI is defending the 45 level, a move that has been seen before March 19, indicated with purple highlights on the RSI chart below.

If the RSI holds above 45, the Dogecoin price recovery could ensue, with the Bitcoin of meme coins likely to retrace back to the 50% Fibonacci placeholder at $0.1946. This would constitute a 15% move above current levels. The Awesome Oscillator (AO) still holding in positive territory reinforces the above thesis.

A show of strength in the Bitcoin price could encourage more buy orders, capable of catapulting the Dogecoin price to reclaim the $0.2287 local top. Reclaiming the $0.2100 threshold decisively would be the first sign.

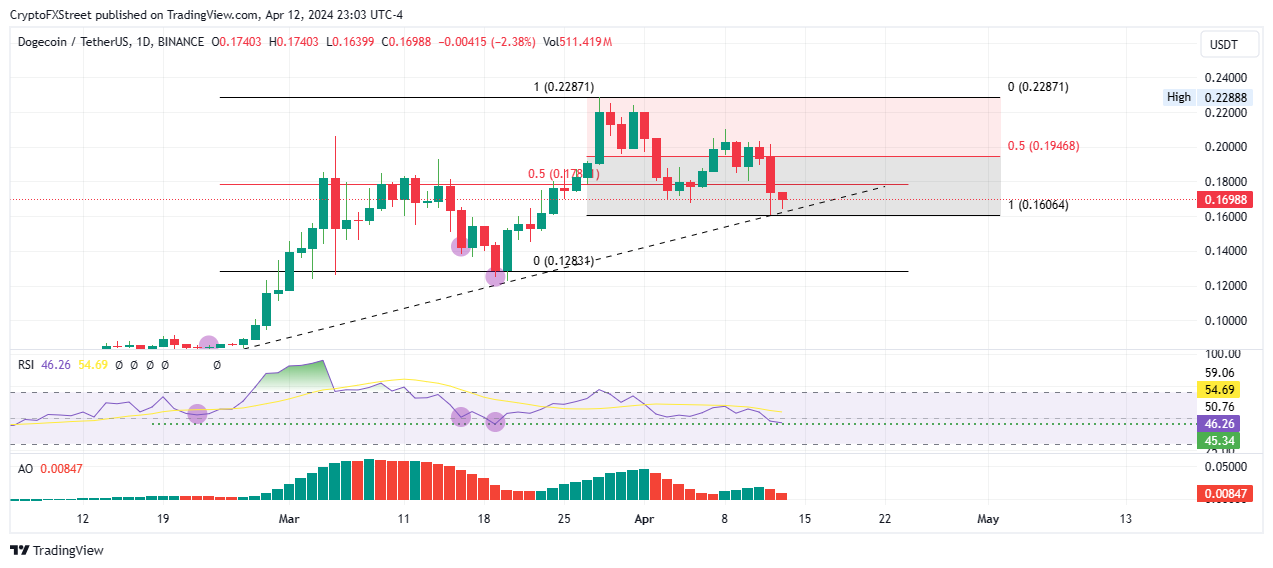
DOGE/USDT 1-day chart

On the other hand, if selling pressure increases, Dogecoin price could slip below $0.1606, not only negating the bullish thesis but also increasing the odds for further downside, potentially as low as the $0.1283 support. Such a move would denote a 25% drop below current levels. 

Disclaimer: For information purposes only. Past performance is not indicative of future results.
placeholder
Gold Price Forecast: XAU/USD drifts higher above $4,200 as Fed delivers expected cutGold price (XAU/USD) gains momentum to around $4,235 during the early Asian session on Thursday. The precious metal extends its upside after the US Federal Reserve (Fed) delivered an expected third consecutive interest rate cut and maintained its outlook for just one cut in 2026.
Author  FXStreet
Dec 11, Thu
Gold price (XAU/USD) gains momentum to around $4,235 during the early Asian session on Thursday. The precious metal extends its upside after the US Federal Reserve (Fed) delivered an expected third consecutive interest rate cut and maintained its outlook for just one cut in 2026.
placeholder
Ethereum Price Slips Lower — $3,000 Looms as the Key BattlegroundEthereum is attempting to recover from a $3,026 low but remains below $3,200 and the 100-hour SMA, with a bearish trend line near $3,175 capping rebounds as bulls need a clean break above $3,200 to target $3,250–$3,400, while a drop below $3,050 risks a retest of $3,000 and $2,940.
Author  Mitrade
Dec 15, Mon
Ethereum is attempting to recover from a $3,026 low but remains below $3,200 and the 100-hour SMA, with a bearish trend line near $3,175 capping rebounds as bulls need a clean break above $3,200 to target $3,250–$3,400, while a drop below $3,050 risks a retest of $3,000 and $2,940.
placeholder
Bitcoin Slides 5% as Sellers Lean In — Can BTC Reclaim $88,000?Bitcoin has dropped back below $88,000 after rolling over from $90,500, with price still trading under the 100-hour Simple Moving Average. The sell-off found a floor at $85,151, and BTC is now consolidating near that base, but rebounds are facing pressure from a bearish trend line around $89,000. Bulls need to retake $88,000–$89,000 to ease downside risk; failure to do so keeps $85,500–$85,000 and then $83,500 in play, with $80,000 as the deeper “line in the sand.” Bitcoin (BTC) is back in damage-control mode after a sharp pullback wiped out recent gains. The price failed to reclaim the $90,000–$90,500 band, rolled over, and slid through $88,500 before briefly dipping under $87,000. Buyers did show up around $85,000, but the rebound so far looks more like stabilization than a clear trend reversal. Bitcoin dips hard, finds a bid near $85,000(h3) BTC’s latest move lower began when it couldn’t build follow-through above $90,000 and $90,500. Once that upside stalled, sellers took control and pushed price down through $88,500. The slide accelerated enough to spike below $87,000, but the market didn’t free-fall. Bulls defended the $85,000 zone, printing a low at $85,151. Since then, Bitcoin has been consolidating below the 23.6% Fibonacci retracement of the drop from the $93,560 swing high to the $85,151 low — a clue that the bounce is still shallow and that sellers haven’t fully backed off yet. Structurally, BTC is still on the back foot: It’s trading below $88,000, and It remains below the 100-hour Simple Moving Average, keeping short-term trend pressure pointed downward. Resistance is layered, and $89,000 is the problem area(h3) If bulls try to turn this into a recovery, they’ll have to climb through multiple ceilings in quick succession. First, BTC faces resistance around $87,150, followed by a more meaningful barrier near $87,500. From there, the market’s attention snaps back to $88,000 — the level BTC just lost and now needs to reclaim. A close back above $88,000 would improve the tone, but it doesn’t solve the bigger issue: there’s a bearish trend line on the hourly BTC/USD chart (Kraken feed) with resistance near $89,000, which also lines up with the next technical hurdle. If BTC can push through $89,000 and hold, the rebound could extend toward $90,000, with follow-through targets at $91,000 and $91,500. But until price clears that $88,000–$89,000 zone, rallies are at risk of being sold rather than chased. If BTC fails to reclaim resistance, the downside path is clear(h3) The near-term bear case is simple: if Bitcoin can’t climb back above the $87,000 area and keep traction, sellers may attempt another leg lower. Support levels line up like this: Immediate support: $85,500 First major support: $85,000 Next support: $83,500 Then $82,500 in the near term Below that, the major “don’t break this” level is still $80,000. If BTC slips under $80,000, the risk of acceleration to the downside increases significantly — not because it’s magic, but because it’s the kind of psychological and structural level that tends to trigger forced de-risking. Indicators: momentum still leans bearish(h3) The intraday indicators aren’t offering much comfort yet: Hourly MACD is losing pace in the bearish zone. Hourly RSI remains below 50, suggesting sellers still have the upper hand on short timeframes. So while the $85,000 defense held for now, the market hasn’t flipped bullish — it’s just stopped bleeding.
Author  Mitrade
Dec 16, Tue
Bitcoin has dropped back below $88,000 after rolling over from $90,500, with price still trading under the 100-hour Simple Moving Average. The sell-off found a floor at $85,151, and BTC is now consolidating near that base, but rebounds are facing pressure from a bearish trend line around $89,000. Bulls need to retake $88,000–$89,000 to ease downside risk; failure to do so keeps $85,500–$85,000 and then $83,500 in play, with $80,000 as the deeper “line in the sand.” Bitcoin (BTC) is back in damage-control mode after a sharp pullback wiped out recent gains. The price failed to reclaim the $90,000–$90,500 band, rolled over, and slid through $88,500 before briefly dipping under $87,000. Buyers did show up around $85,000, but the rebound so far looks more like stabilization than a clear trend reversal. Bitcoin dips hard, finds a bid near $85,000(h3) BTC’s latest move lower began when it couldn’t build follow-through above $90,000 and $90,500. Once that upside stalled, sellers took control and pushed price down through $88,500. The slide accelerated enough to spike below $87,000, but the market didn’t free-fall. Bulls defended the $85,000 zone, printing a low at $85,151. Since then, Bitcoin has been consolidating below the 23.6% Fibonacci retracement of the drop from the $93,560 swing high to the $85,151 low — a clue that the bounce is still shallow and that sellers haven’t fully backed off yet. Structurally, BTC is still on the back foot: It’s trading below $88,000, and It remains below the 100-hour Simple Moving Average, keeping short-term trend pressure pointed downward. Resistance is layered, and $89,000 is the problem area(h3) If bulls try to turn this into a recovery, they’ll have to climb through multiple ceilings in quick succession. First, BTC faces resistance around $87,150, followed by a more meaningful barrier near $87,500. From there, the market’s attention snaps back to $88,000 — the level BTC just lost and now needs to reclaim. A close back above $88,000 would improve the tone, but it doesn’t solve the bigger issue: there’s a bearish trend line on the hourly BTC/USD chart (Kraken feed) with resistance near $89,000, which also lines up with the next technical hurdle. If BTC can push through $89,000 and hold, the rebound could extend toward $90,000, with follow-through targets at $91,000 and $91,500. But until price clears that $88,000–$89,000 zone, rallies are at risk of being sold rather than chased. If BTC fails to reclaim resistance, the downside path is clear(h3) The near-term bear case is simple: if Bitcoin can’t climb back above the $87,000 area and keep traction, sellers may attempt another leg lower. Support levels line up like this: Immediate support: $85,500 First major support: $85,000 Next support: $83,500 Then $82,500 in the near term Below that, the major “don’t break this” level is still $80,000. If BTC slips under $80,000, the risk of acceleration to the downside increases significantly — not because it’s magic, but because it’s the kind of psychological and structural level that tends to trigger forced de-risking. Indicators: momentum still leans bearish(h3) The intraday indicators aren’t offering much comfort yet: Hourly MACD is losing pace in the bearish zone. Hourly RSI remains below 50, suggesting sellers still have the upper hand on short timeframes. So while the $85,000 defense held for now, the market hasn’t flipped bullish — it’s just stopped bleeding.
placeholder
December Santa Claus Rally: New highs in sight for US and European stocks?Historical data show a rising trend of US and European stocks in December. If the momentum is strong, fund managers may rush in with a buying frenzy.
Author  Mitrade
Yesterday 02: 50
Historical data show a rising trend of US and European stocks in December. If the momentum is strong, fund managers may rush in with a buying frenzy.
placeholder
XRP’s Price Action Flashes a Warning Even as ETF Flows Stay PositiveXRP’s structure remains weak despite 18 straight positive closes in spot XRP ETFs, with analysts warning that $1.98 and other nearby resistance zones could cap rebounds unless the YO region is reclaimed, while deeper downside scenarios keep $1.53 on watch as a potential (not guaranteed) accumulation area.
Author  Mitrade
Yesterday 06: 37
XRP’s structure remains weak despite 18 straight positive closes in spot XRP ETFs, with analysts warning that $1.98 and other nearby resistance zones could cap rebounds unless the YO region is reclaimed, while deeper downside scenarios keep $1.53 on watch as a potential (not guaranteed) accumulation area.
goTop
quote