

Top Crypto Gainers: UNI, WLFI, and TRUMP rally as Trump backs US shutdown resolution deal
- Uniswap rebound rally approaches the $10 mark, driven by the new governance proposal.
- World Liberty Financial token holds above $0.1500 after a 21% surge on Monday.
- Official Trump token takes a breather following Monday's 15% gains, testing a monthly resistance level.
Uniswap (UNI), World Liberty Financial (WLFI), and Official Trump (TRUMP) outperformed the broader cryptocurrency market over the last 24 hours, which was underpinned by Donald Trump's support for a bipartisan deal to resolve the longest US government shutdown on Monday.
Uniswap rallies on new governance proposal
Uniswap’s new governance proposal, which aims to activate protocol fees and use the collected fees to burn UNI tokens, is similar to Hyperliquid (HYPE), which utilizes the revenue to reduce supply through token buybacks. An additional 100 million tokens from the Uniswap treasury will be burned, representing the tokens that would have been burned if protocol fees were integrated at the token launch.
Uniswap extends the uptrend for the fifth consecutive day, approaching the $10 mark. At the time of writing, UNI holds 4% gains on Tuesday, following the 42% rise on Monday.
A decisive close above the September 13 high of $10.36 could extend the Decentralized Exchange (DEX) token to the R2 Pivot Point at $12.04.
The Relative Strength Index (RSI) is at 76 on the daily chart, indicating overbought conditions and extreme buying pressure, which risks the sustainability of the uptrend. Meanwhile, a sharp rise in the Moving Average Convergence Divergence (MACD) line occurs as it crosses above the zero line, followed by its signal line, suggesting an increase in bullish momentum.
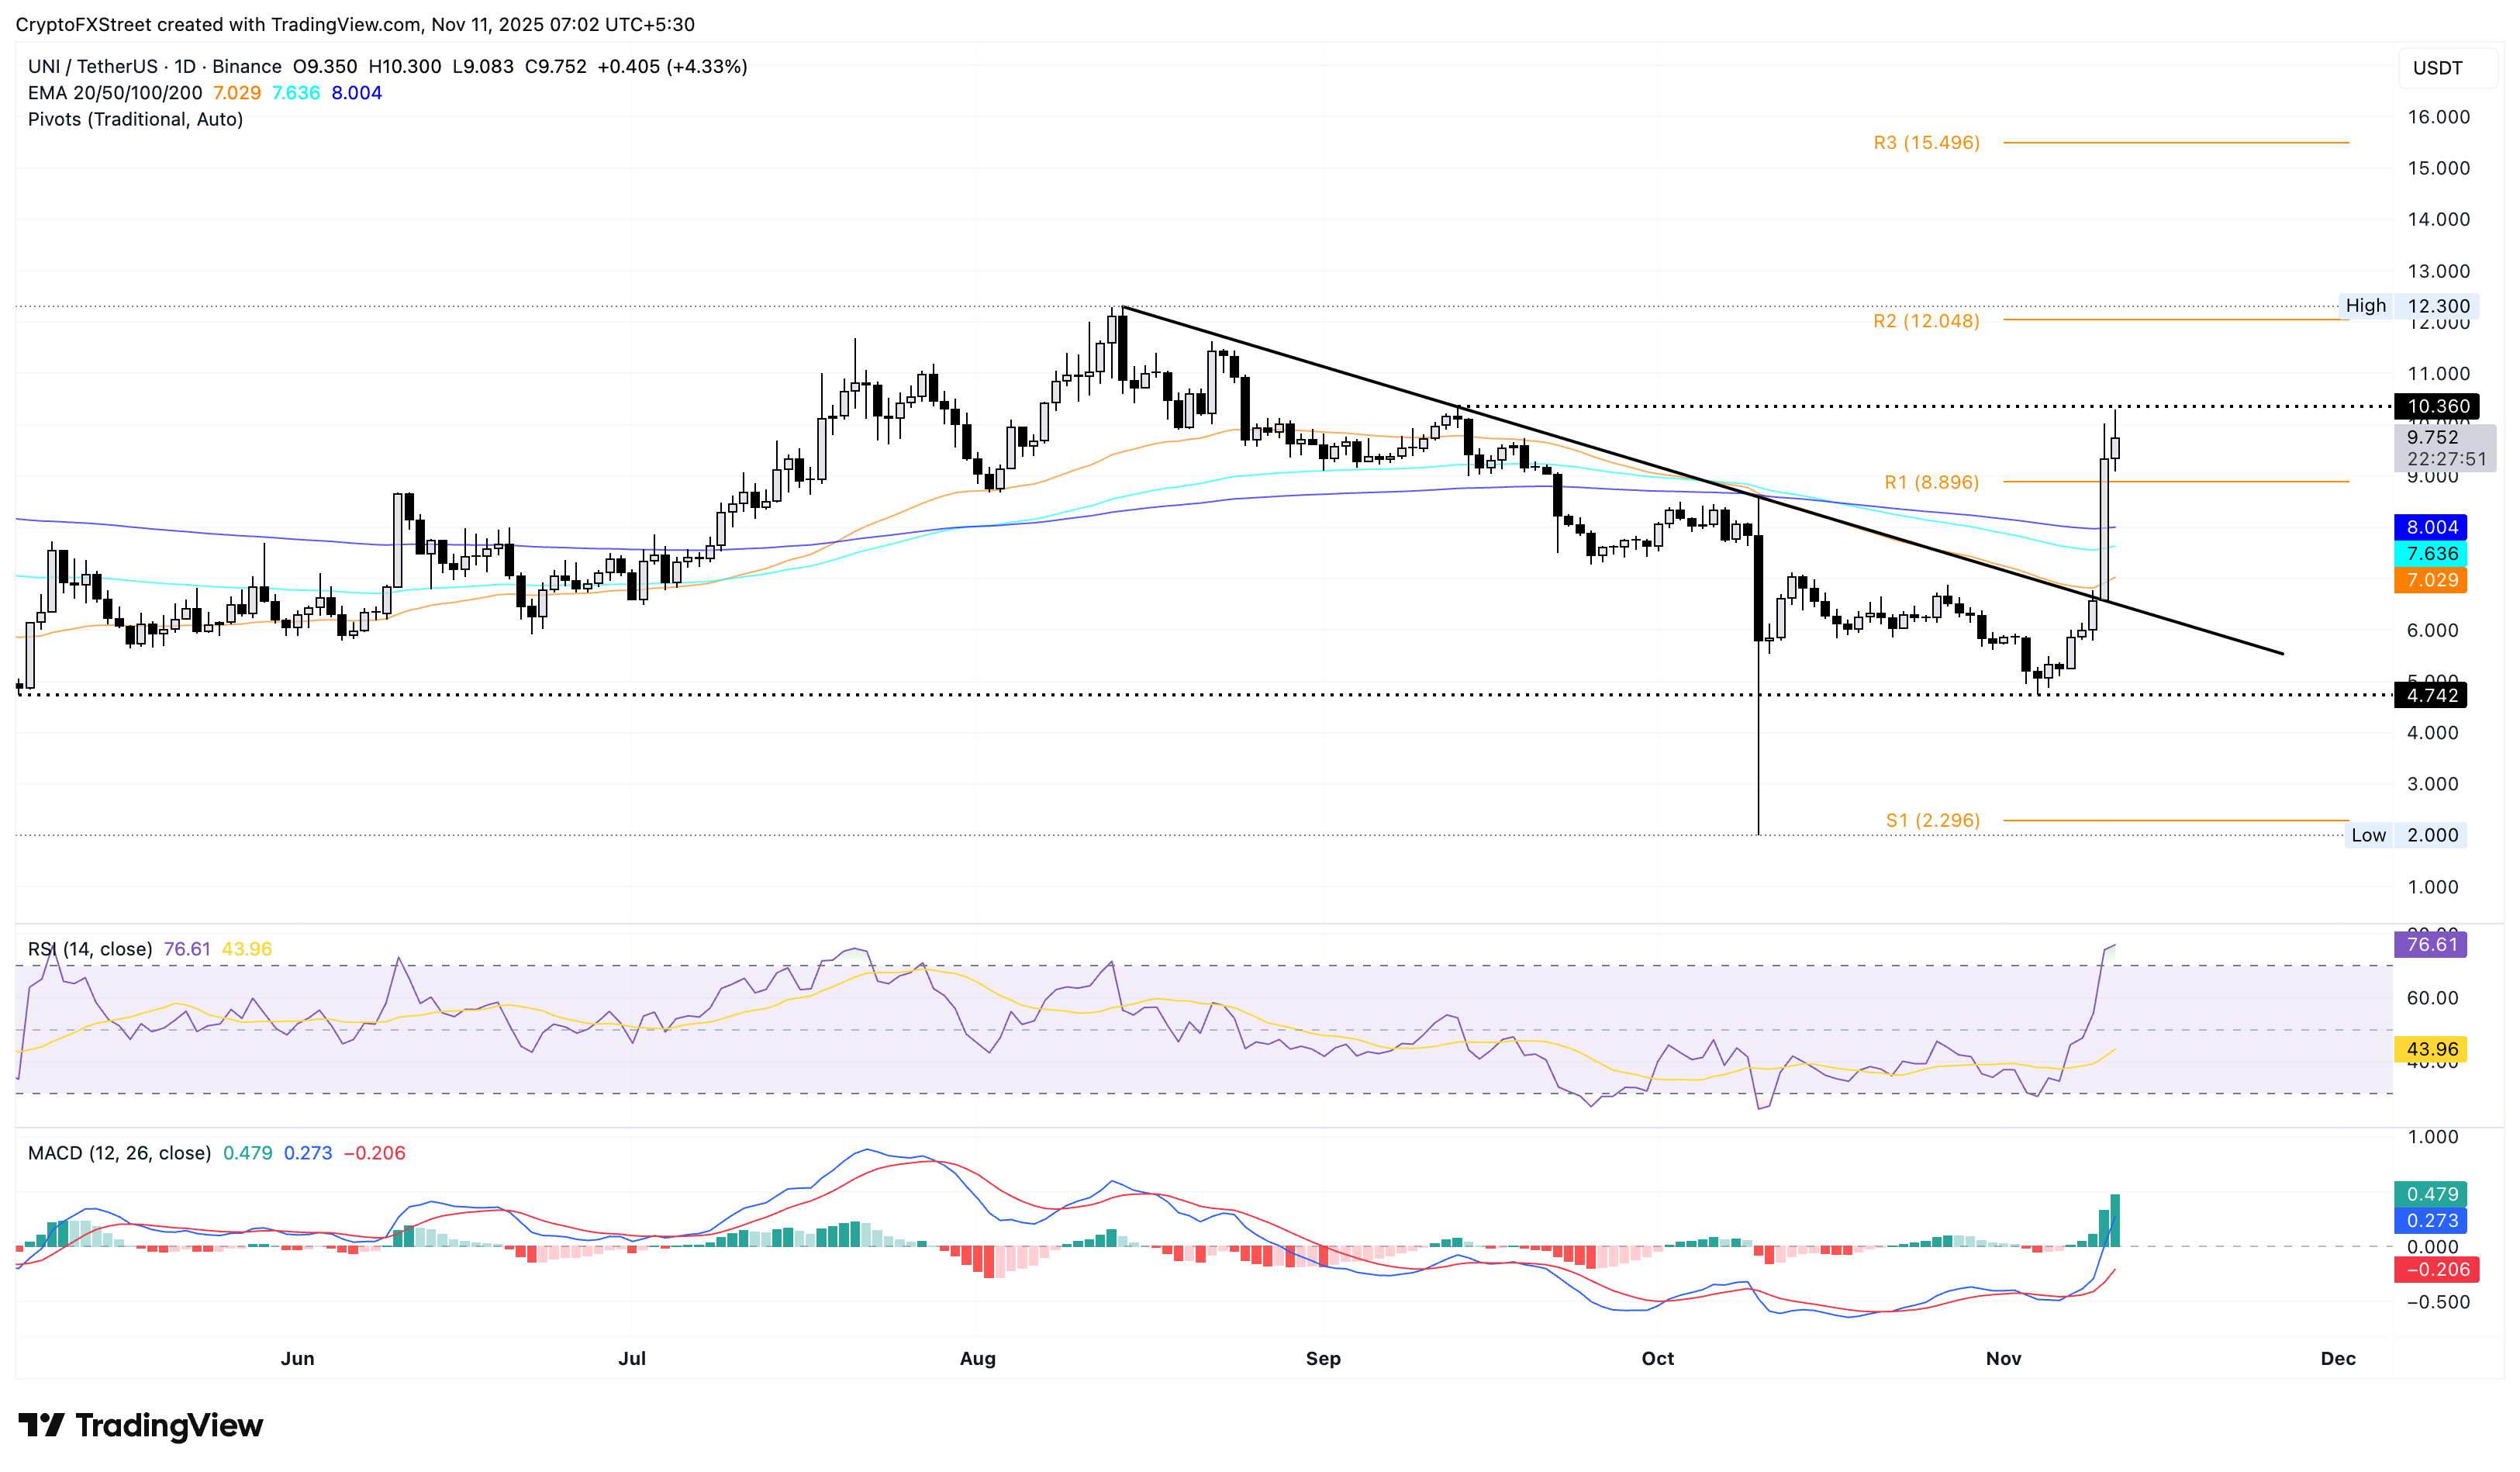
On the other hand, the 200-day Exponential Moving Average (EMA) at $8.00 could serve as support.
World Liberty Financial gains bullish momentum
World Liberty Financial token edges higher by 1% at press time on Tuesday, extending the 21% gains from Monday. The WLFI rally holds above $0.1500 following a breakout of the resistance trendline on the 4-hour chart.
Key resistances for the WLFI rally stand at $0.1814 and $0.2228, marked by the low of September 26 and high of September 29, respectively.
The RSI at 70 on the 4-hour chart indicates a steady rise in buying pressure. Meanwhile, the uptrending MACD and signal line reflect a surge in bullish momentum.
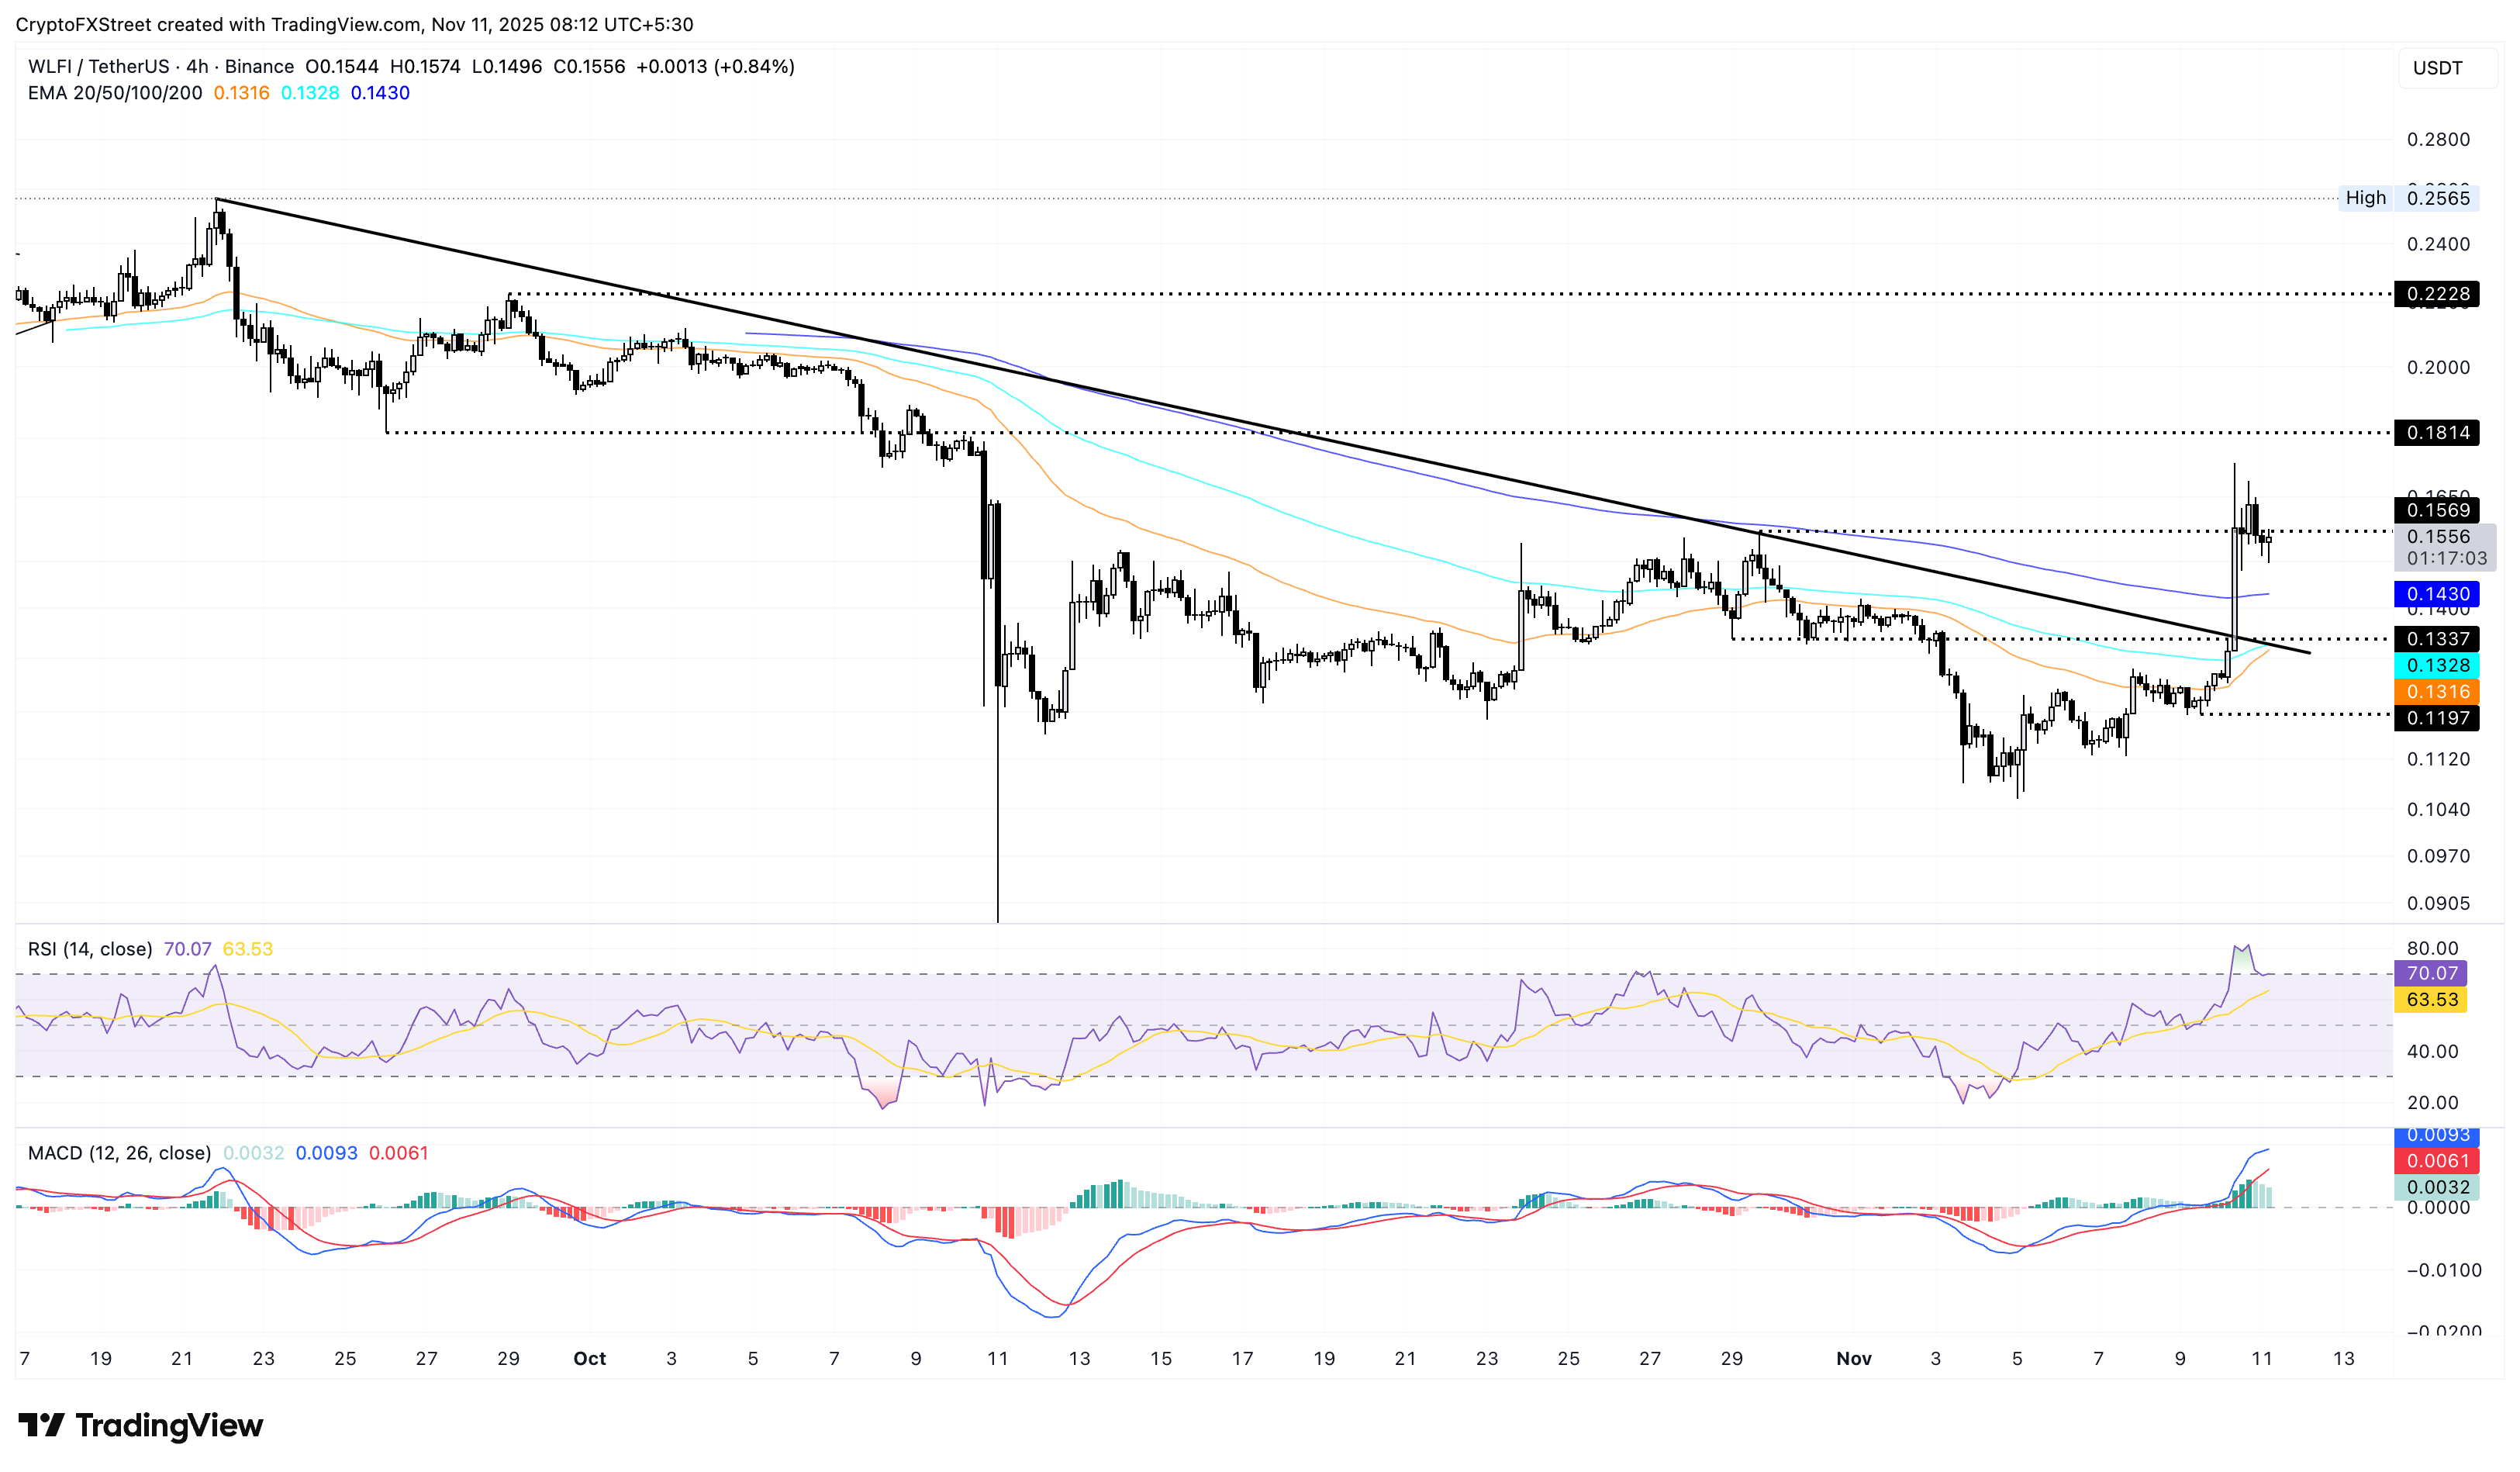
On the downside, the 200-period EMA at $0.1430 remains a key support level.
Official Trump breaks free of a descending channel
Official Trump token breaks out of a falling channel pattern on the daily chart, signaling a bullish trend reversal. At the time of writing, the TRUMP token is edging lower by over 2% on Tuesday, following a 15% rise the previous day.
The recovery in the TRUMP token struggles to surpass the $9.571 resistance that has remained intact since August 15, failing to achieve a daily close. If the Official Trump token successfully clears this level, the breakout rally could face opposition at the R1 and R2 Pivot Points at $10.630 and $13.249, respectively.
Similar to WLFI, the official meme coin of US President Donald Trump, is gaining traction, as the RSI at 61 shows a consistent increase in buy-side activity. At the same time, the MACD diverges from the signal line, extending the uptrend and indicating renewed bullish momentum.
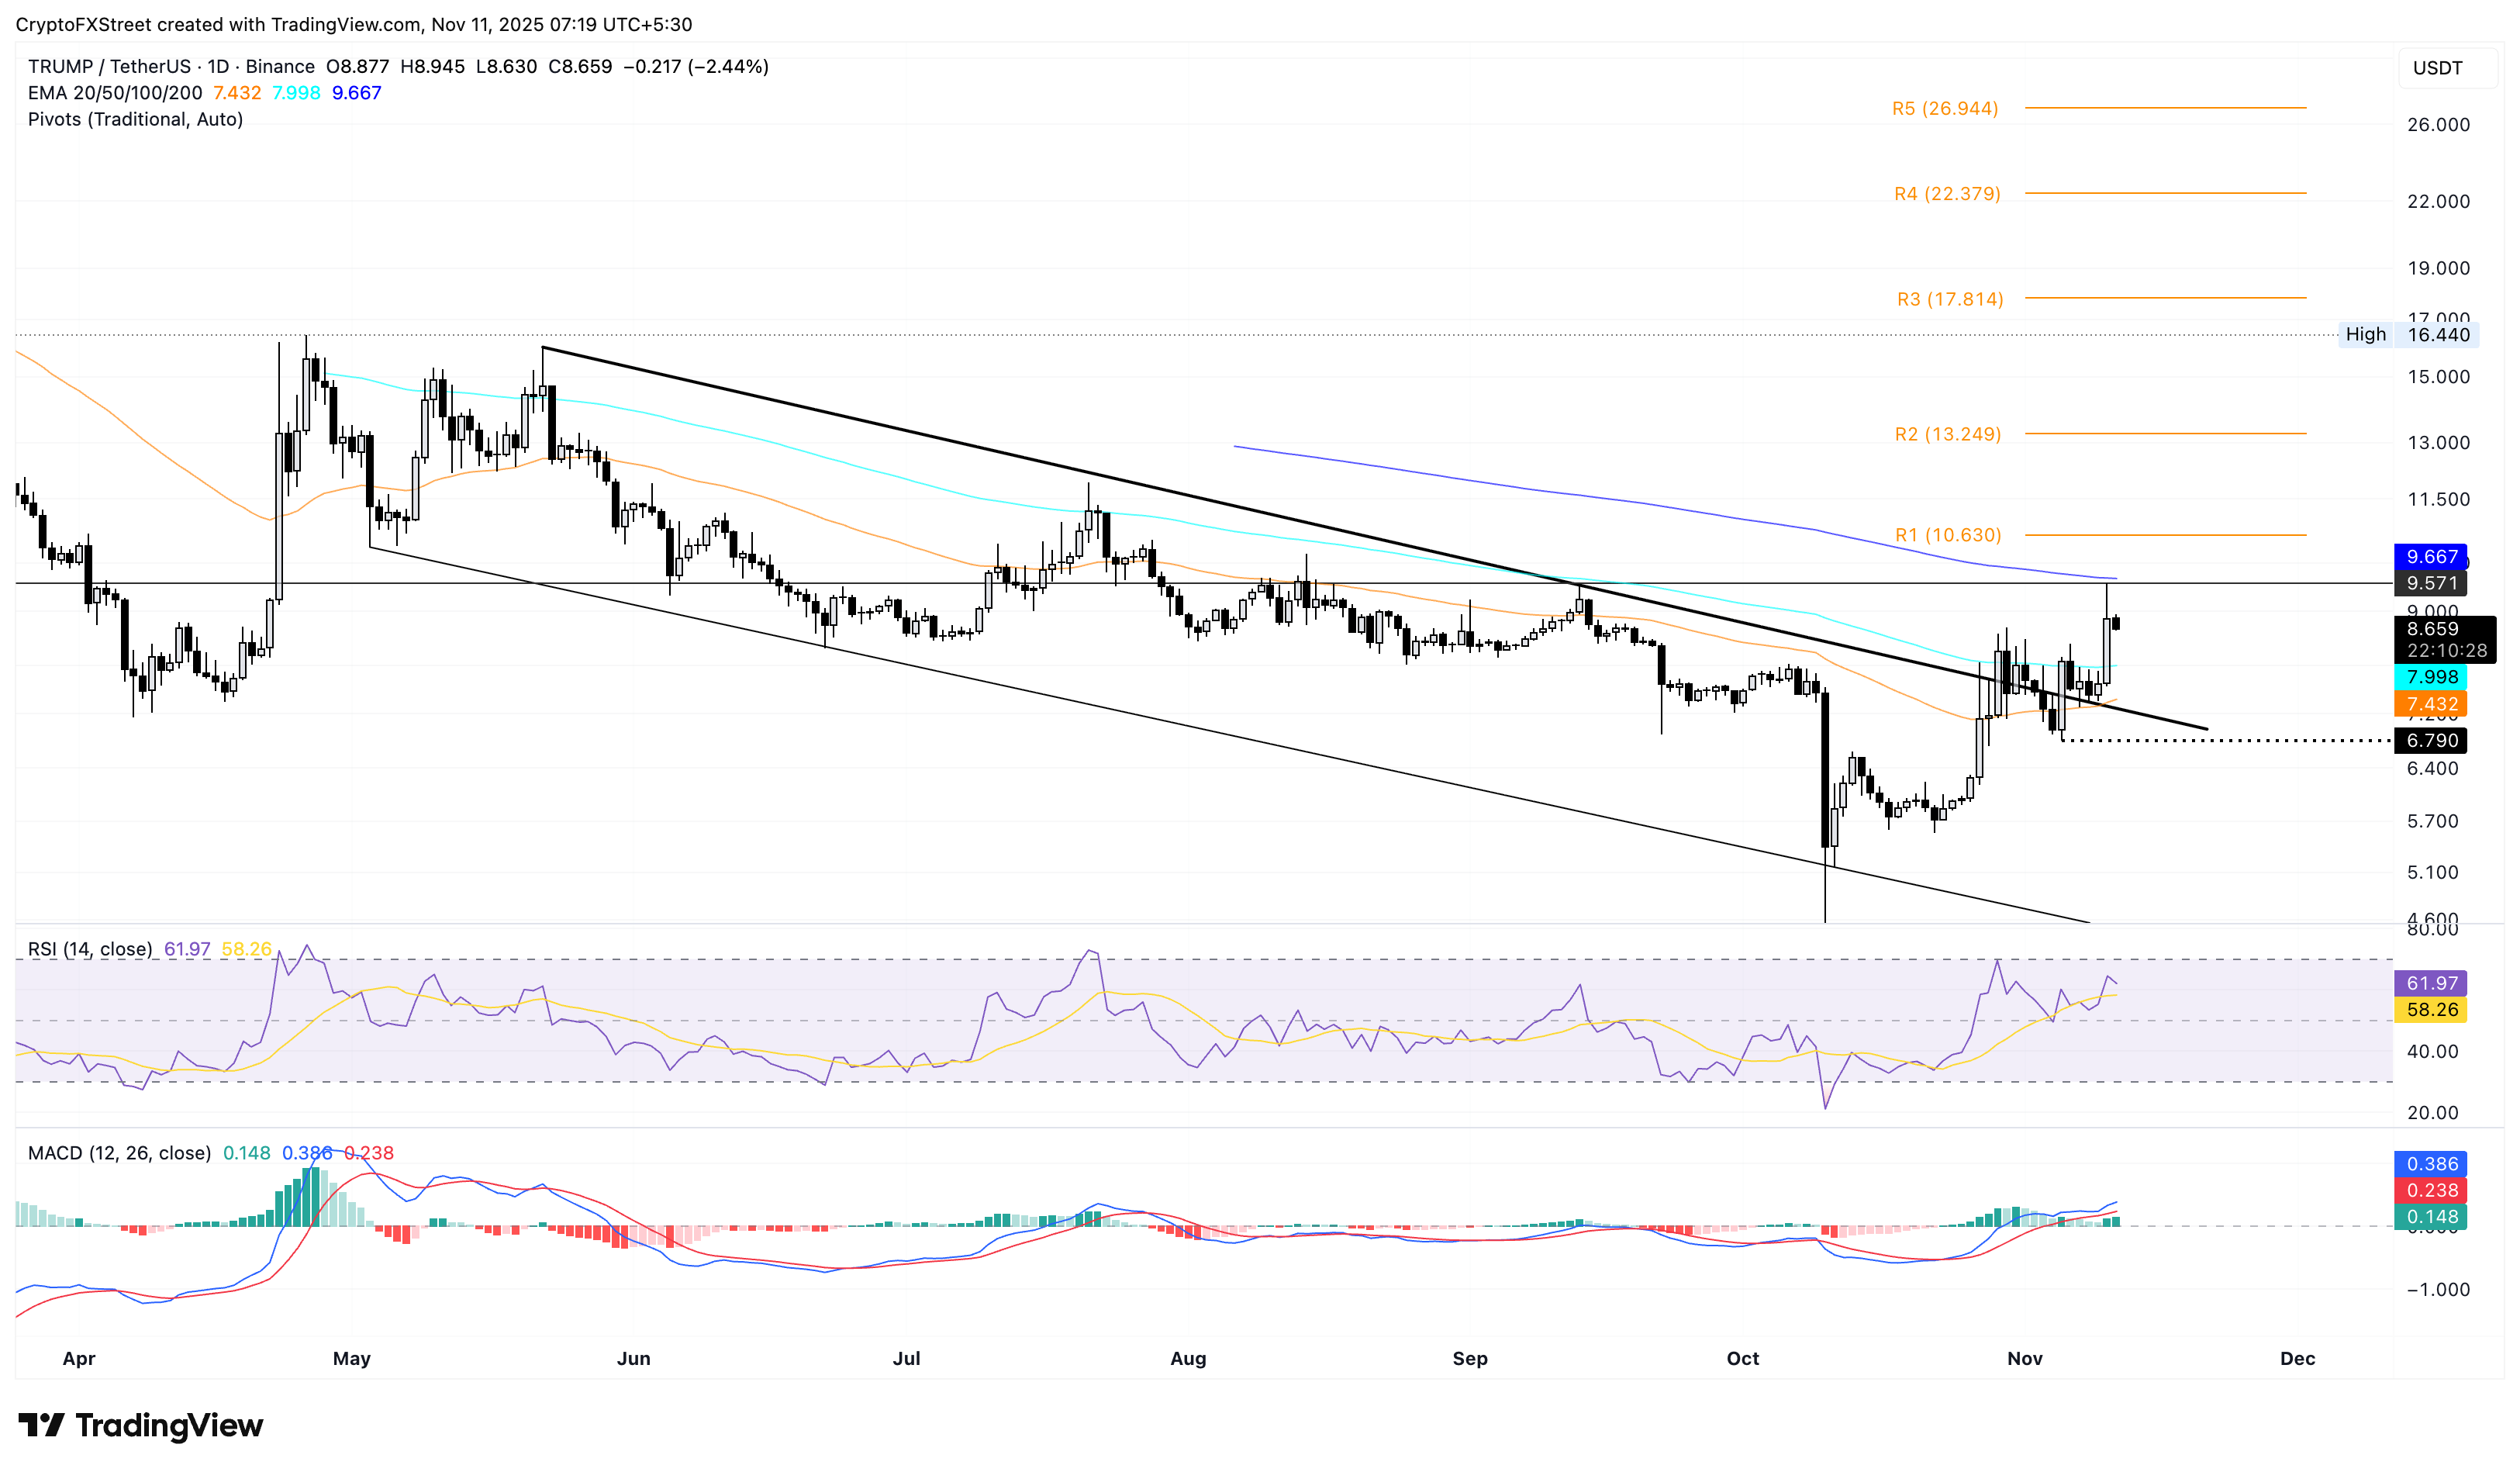
Looking down, if TRUMP reverses from the 200-day EMA, it could test the 100-day EMA at $0.7998.
Recommended Articles


