

Bitcoin Handles $14B OI Drop As Spot Volume Surged To $44B: Controlled Reset?
Bitcoin is testing a critical support level near $110,000 after being rejected from the $116,000 supply zone, a level that has now become a major point of contention between bulls and bears. The market remains fragile following the historic volatility from Friday’s crash, which erased billions in leveraged positions and triggered widespread uncertainty.
While the price has managed to stabilize above key moving averages for now, momentum appears to be weakening as buyers struggle to absorb continued selling pressure. Some analysts warn that if Bitcoin fails to hold this zone, a deeper correction toward the $105,000–$107,000 region could follow, marking another shakeout before a potential recovery.
Top analyst Axel Adler shared new data shedding light on the magnitude of Friday’s event. According to his analysis, spot trading volume surged to $44 billion, nearing cycle highs, while futures volume hit $128 billion. More notably, open interest declined by $14 billion, yet only $1 billion of that was from BTC long liquidations. Adler explains this was a controlled deleveraging event, not a liquidation cascade — suggesting that market participants reduced risk manually rather than being forced out. Still, volatility remains elevated as Bitcoin fights to maintain structural support.
A Controlled Reset Amid Growing Fear
According to Axel Adler, the recent market crash revealed an important yet underappreciated aspect of Bitcoin’s maturity. Data shows that 93% of the $14 billion decline in open interest (OI) during Friday’s sell-off wasn’t forced — meaning it wasn’t the result of automatic liquidations. Instead, traders and institutions chose to reduce leverage manually, closing positions to protect capital. Adler describes this as a “controlled deleveraging”, a stark contrast to previous cycles where similar crashes often triggered chaotic cascades of liquidations.
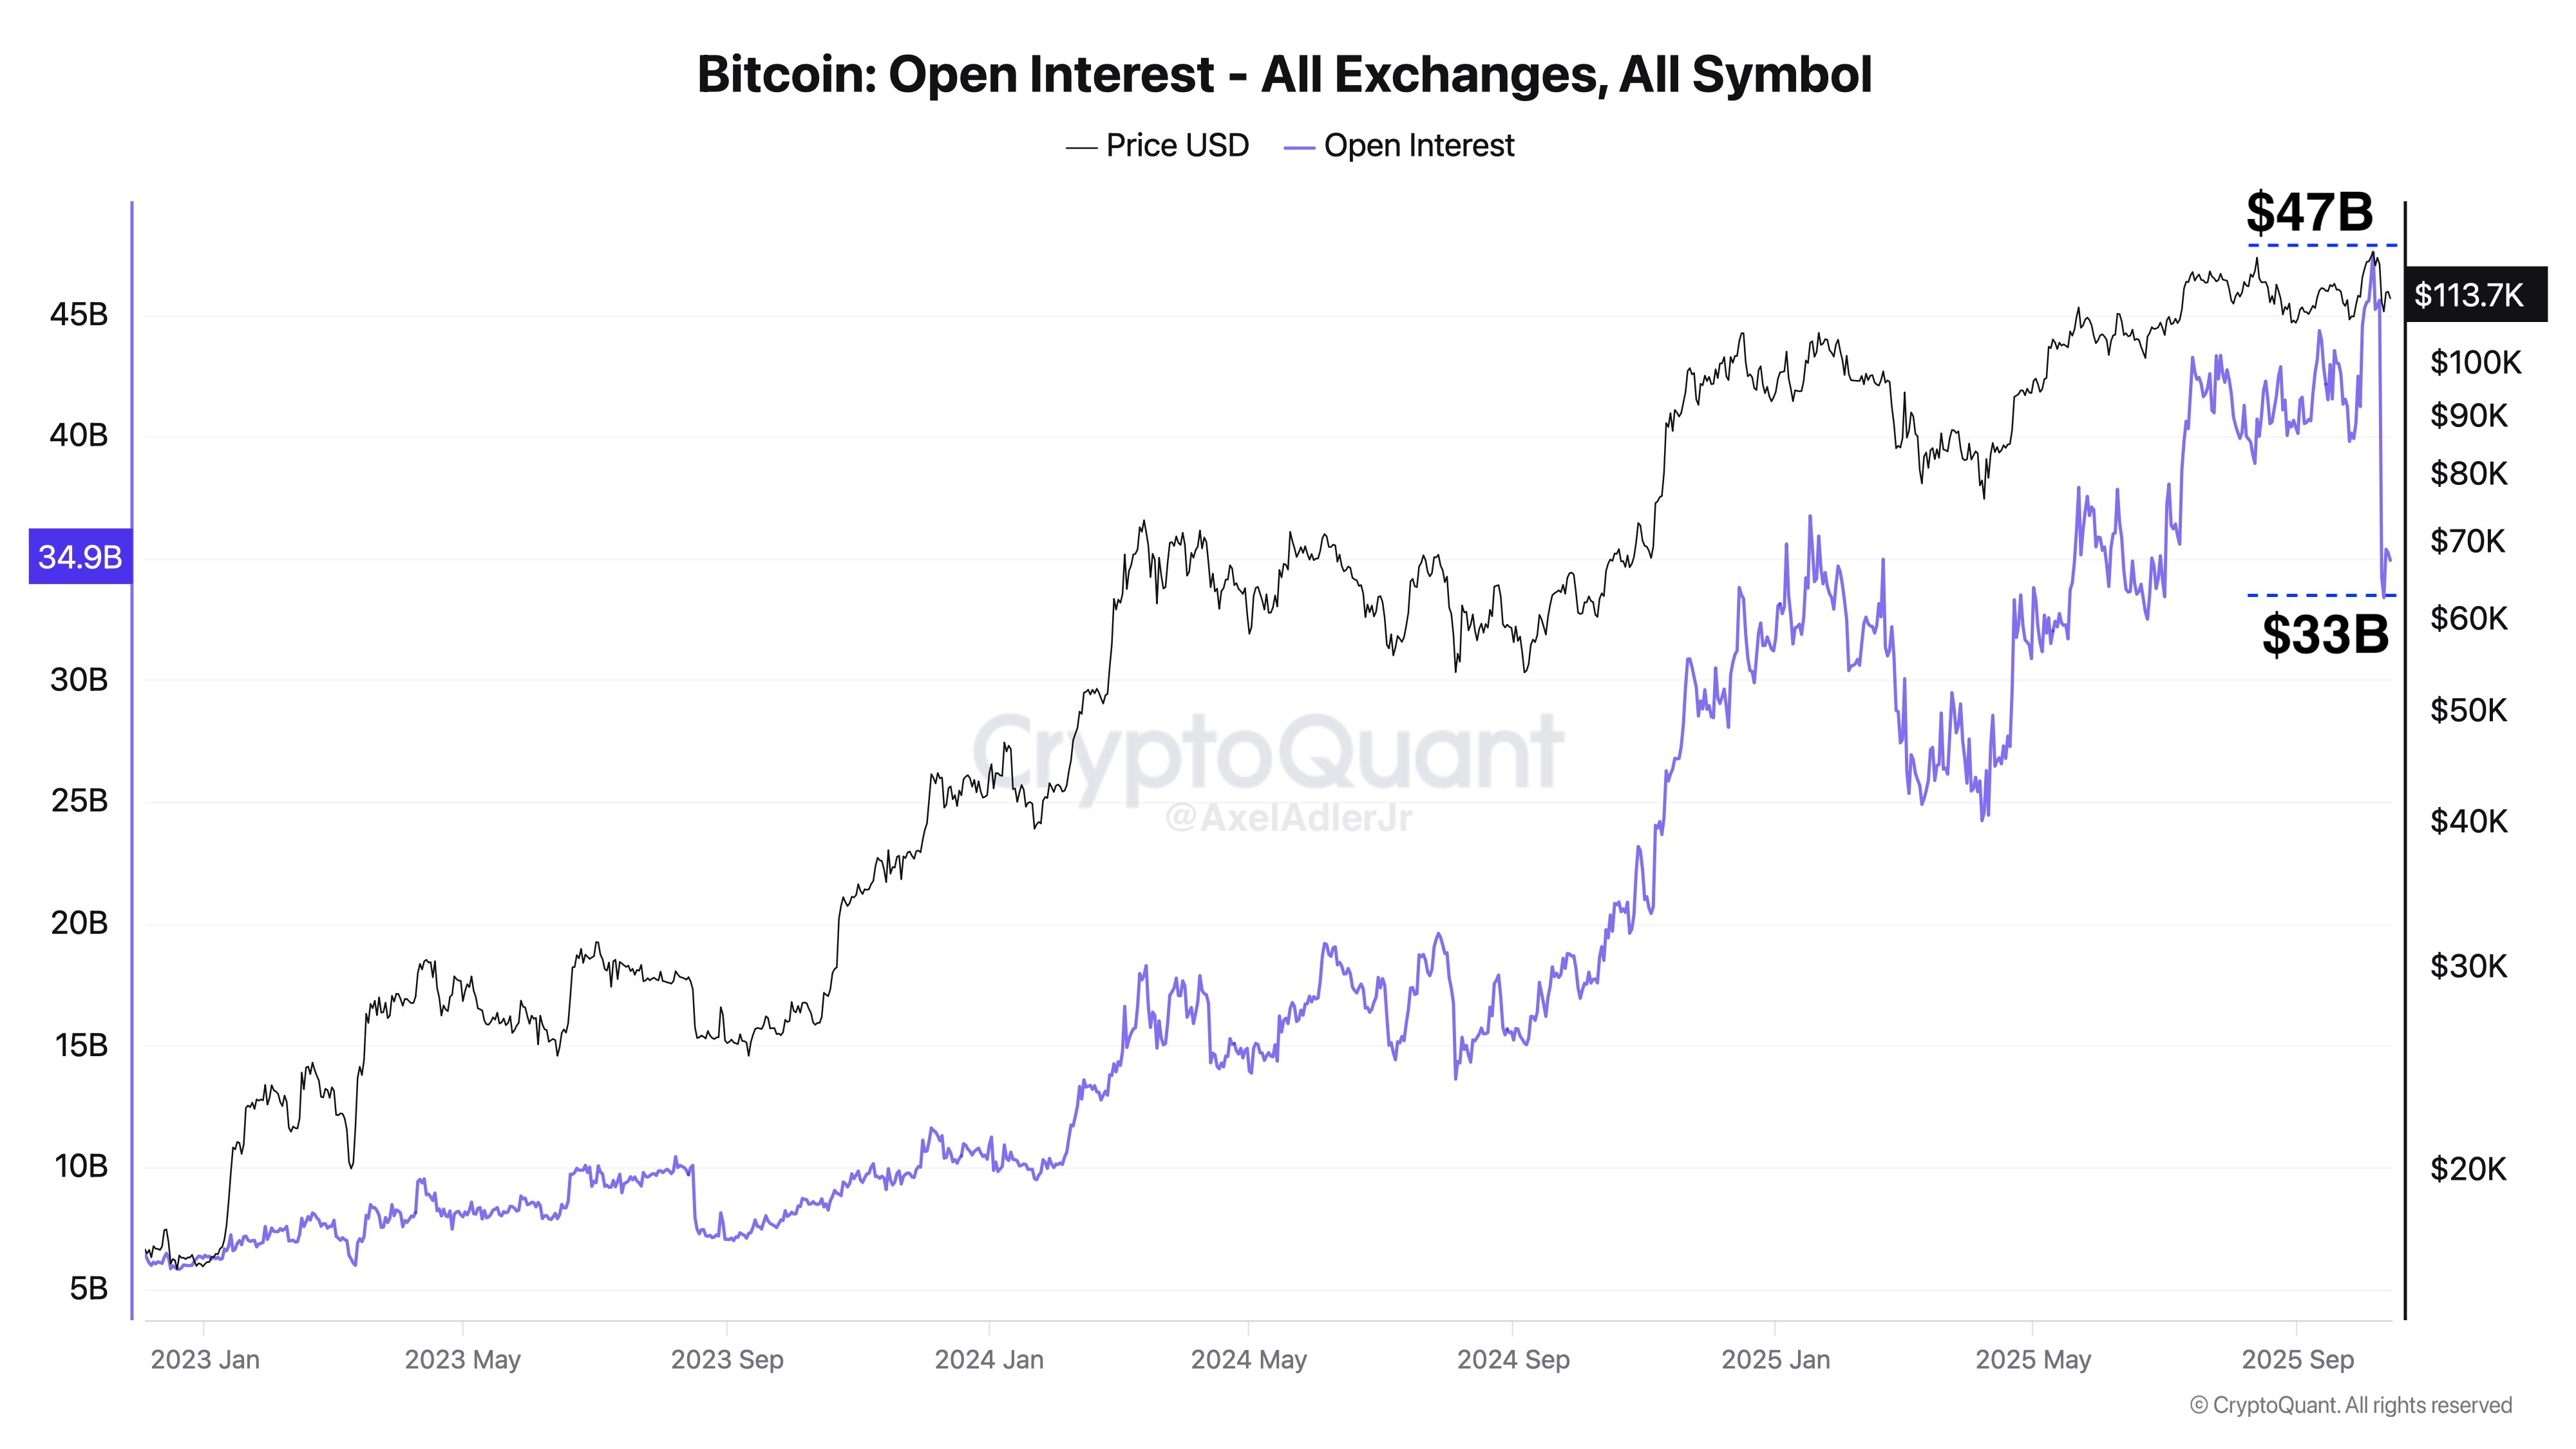
This behavior marks a turning point in Bitcoin’s market structure. It indicates that participants — especially institutional players — are managing risk more prudently, reinforcing a more stable and mature trading environment. In past cycles, sharp liquidations often caused extreme volatility, magnifying losses across the board. This time, however, the market handled unprecedented stress with relative discipline.
Still, despite this sign of structural maturity, the emotional landscape has shifted dramatically. As Bitcoin loses value and hovers near the $110,000–$112,000 support zone, fear is spreading across the market. Many short-term traders are exiting positions, while long-term holders are reassessing exposure amid rising uncertainty. Adler notes that this phase — where fear peaks and confidence wanes — often defines the next market direction.
If demand returns at these levels, Bitcoin could confirm a healthy reset before the next rally. But failure to hold support may test investors’ conviction, potentially pushing BTC into a deeper corrective phase before broader accumulation resumes.
Bitcoin Holds Key Support, But Momentum WeakensBitcoin is currently trading around $110,300, sitting directly on a key support zone after another round of selling pressure hit the market. The 4-hour chart shows BTC struggling to maintain upward momentum after failing to break above the $116,000–$117,500 resistance range, a level that previously acted as strong demand during earlier rallies.

The rejection from this area triggered a sharp pullback, pushing BTC below both the 50 EMA (blue line) and the 200 EMA (red line) — a sign of weakening short-term structure. The price is now testing horizontal support around $110,000, which aligns with the late September consolidation range. A clean breakdown below this level could expose Bitcoin to further downside, with the next potential support around $106,000–$107,000.
Despite the bearish tone, oversold signals are beginning to appear on lower timeframes, suggesting that a temporary rebound is possible if bulls defend this zone successfully. For a sustainable recovery, Bitcoin must reclaim $114,000 and re-establish itself above the short-term moving averages. Until then, the market remains in a fragile equilibrium — with bulls defending key support and bears maintaining control of short-term momentum. The next few sessions will be decisive for BTC’s direction.
Featured image from ChatGPT, chart from TradingView.com
Recommended Articles


