

Sui Price Forecast: SUI rebounds amid record-high TVL, suiUSDe announcement

Source Fxstreet
  • SUI price advances in an upcycle within a symmetrical triangle pattern on the daily chart.
  • Sui Network’s TVL reaches a record high of over $2.8 billion, as DEX volume shows a steady increase.
  • Sui announced suiUSDe, a native stablecoin powered by Ethena.

Sui (SUI) price advances above $3.50 at the time of writing on Thursday, fueled by the announcement of the suiUSDe stablecoin. Meanwhile, the Total Value Locked (TVL) is at record-high levels, and rising Open Interest supports the bullish technical outlook. 

SuiUSDe launch aligns with Sui network growth 

Sui and Nasdaq-listed SUI Group Holdings Limited have announced the launch of a native stablecoin, suiUSDe, powered by Ethena. SuiUSDe will be backed by multiple digital assets and corresponding short futures positions. This adds to the list of USDi, a stablecoin by BlackRock USD Institutional Digital Liquidity Fund (BUIDL) tokenized money market fund to be launched on Sui. 

DeFiLlama data indicate that the stablecoin market capitalization on Sui has increased by 18.61% in the last 24 hours, reaching $682.39 million, with USDC Dominance, backed by Circle, accounting for 66.97%.
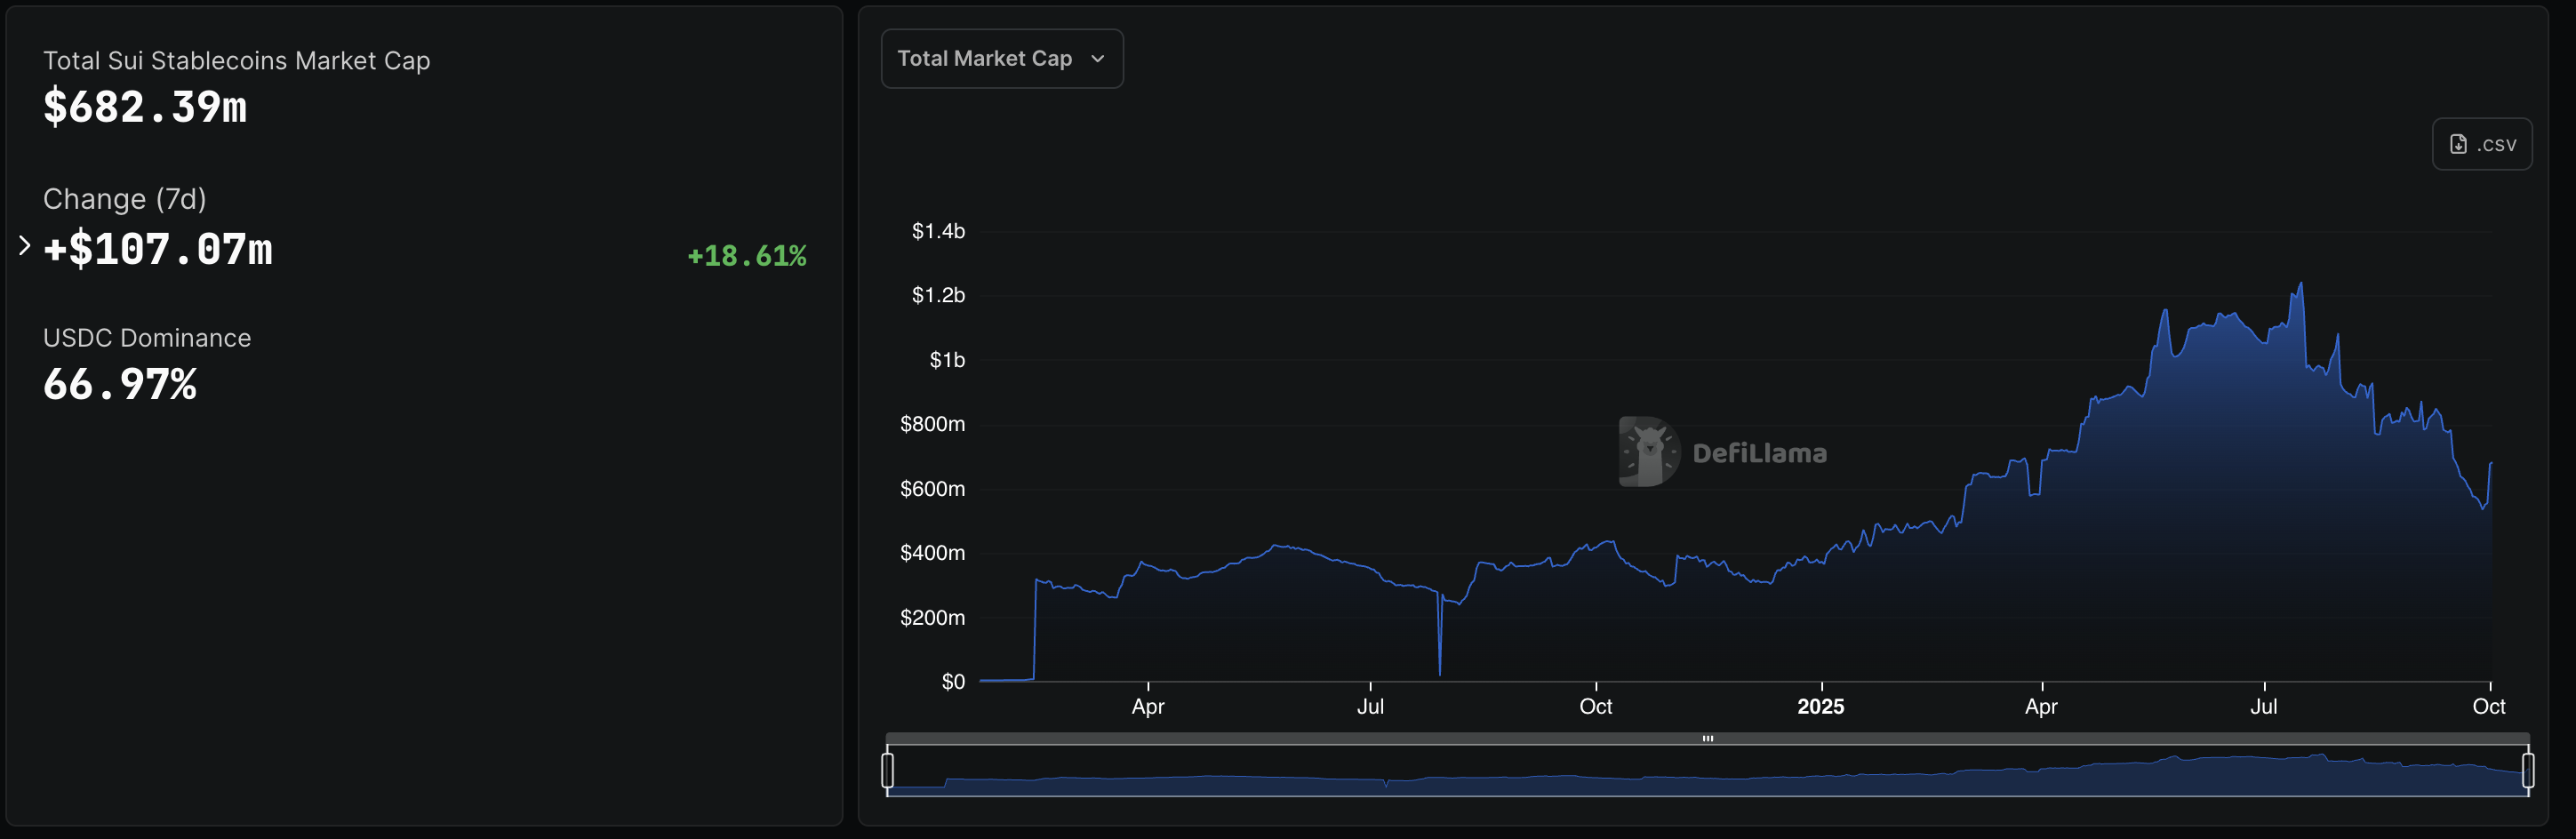
Sui Stablecoin market. Source: DeFiLlama

Apart from the rise of stablecoins, the Decentralized Exchange (DEX) trading volume on the network has remained steady above $500 million for the past three days. Additionally, the TVL on Sui Network has reached a record high of $2.388 billion, indicating elevated liquidity and user adoption. 
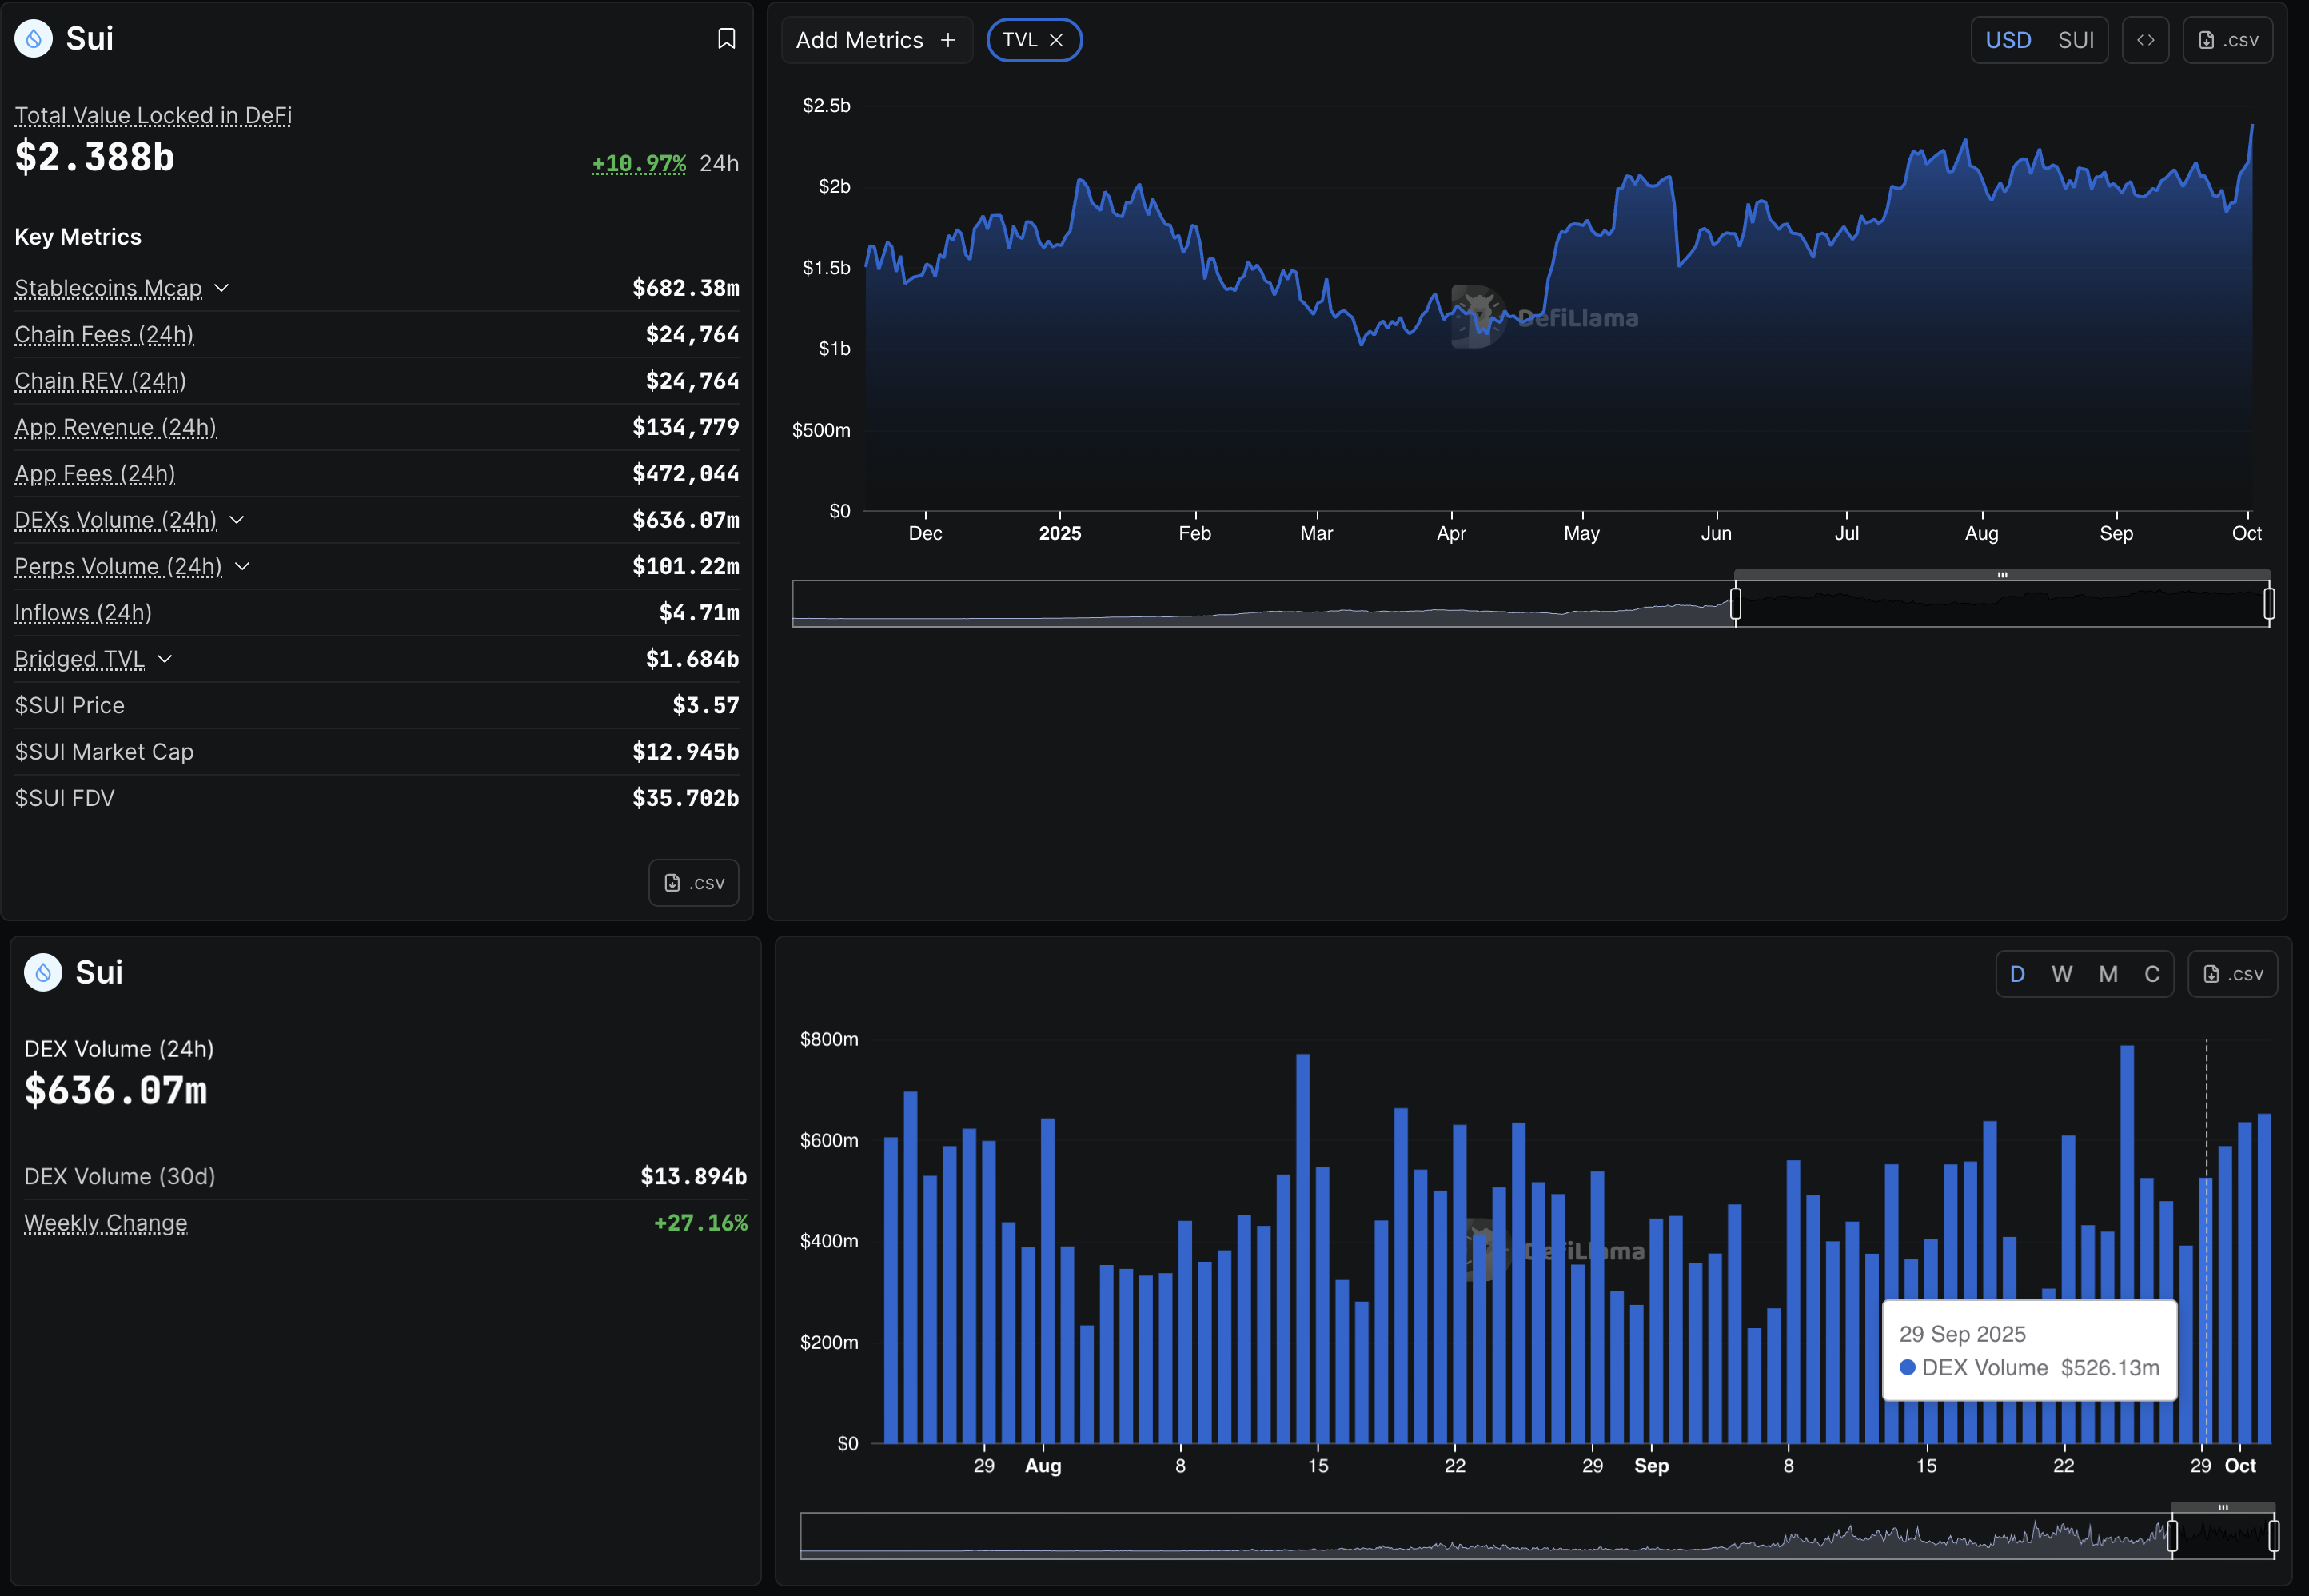
Sui TVL and DEX volume. Source: DeFiLlama

Sui rebounds within a symmetrical triangle 

Sui edges higher by 1% at press time on Thursday, advancing the 8% surge from the previous day. The recovery run marks an upcycle within a symmetrical triangle pattern on the daily chart.

SUI trades above the 50% Fibonacci retracement level at $3.5430, retraced from the $5.3687 high of January 6 to the $1.7174 low of April 7. A decisive close above this level could stretch the recovery run to the 61.8% Fibonacci retracement level at $3.9739 near the triangle’s resistance trendline. 

CoinGlass data indicates that the Open Interest (OI) of SUI has increased to $1.83 billion, up from $1.68 billion on Wednesday. This suggests risk-on sentiment among SUI derivatives traders.
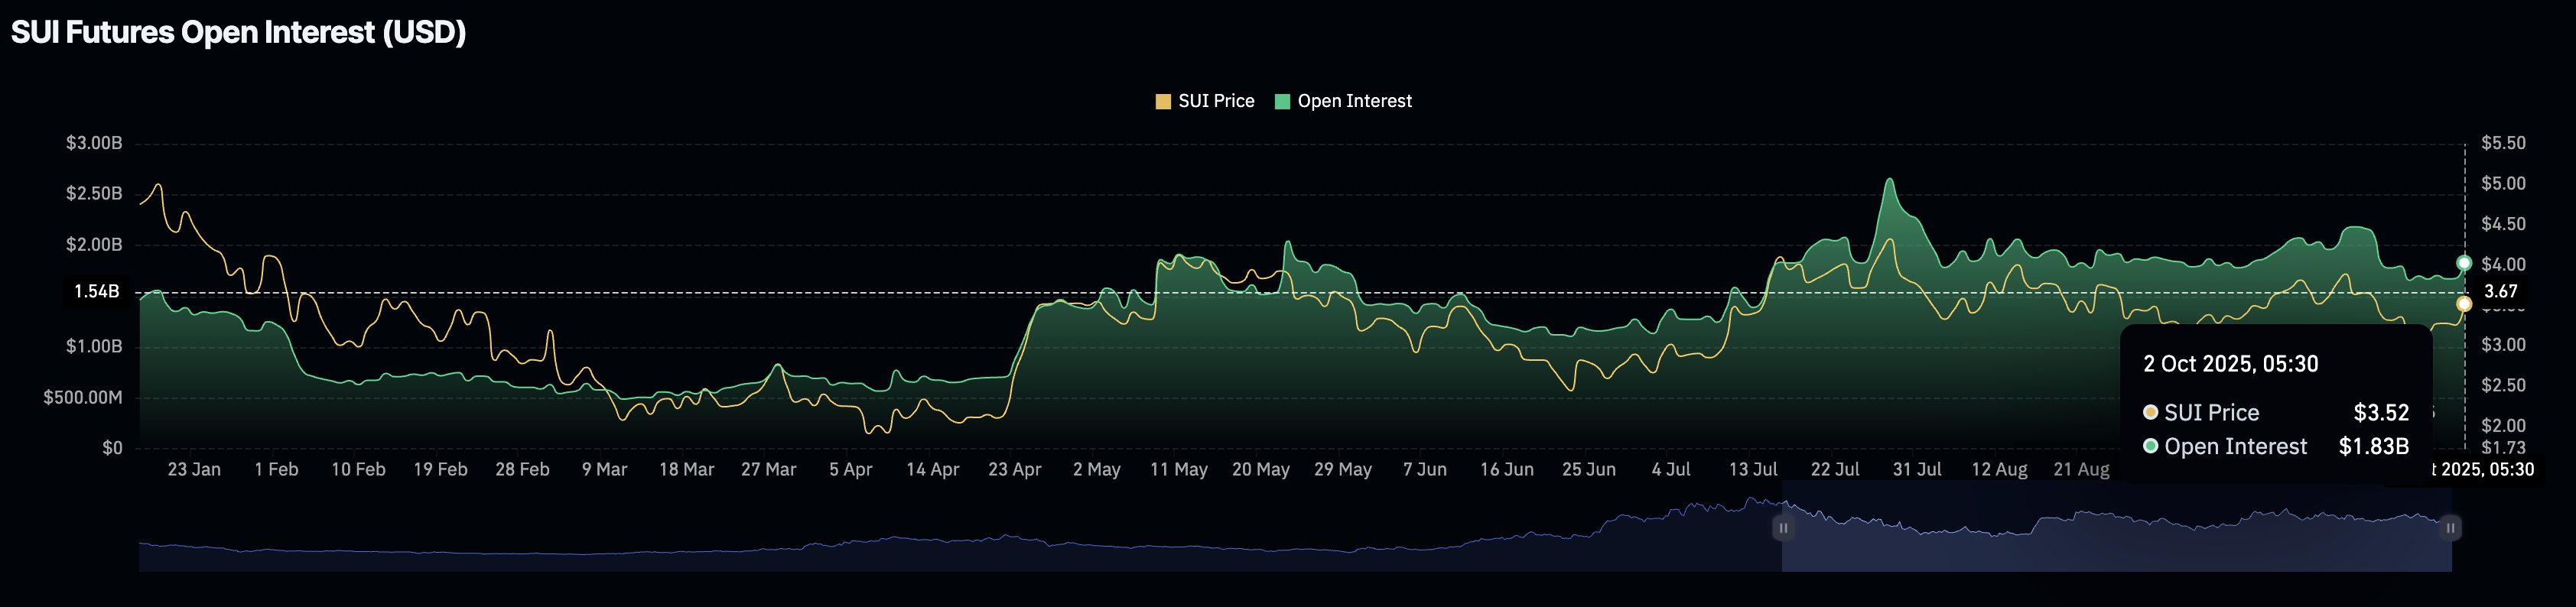
SUI Open Interest. Source: CoinGlass

The technical indicators on the daily chart corroborate the rise in buying pressure, as the Relative Strength Index (RSI) at 54 displays a steady uptrend above the midpoint. Additionally, the Moving Average Convergence Divergence (MACD) signals a bullish shift in momentum, as the crossover of the average lines indicates a new uptrend. 
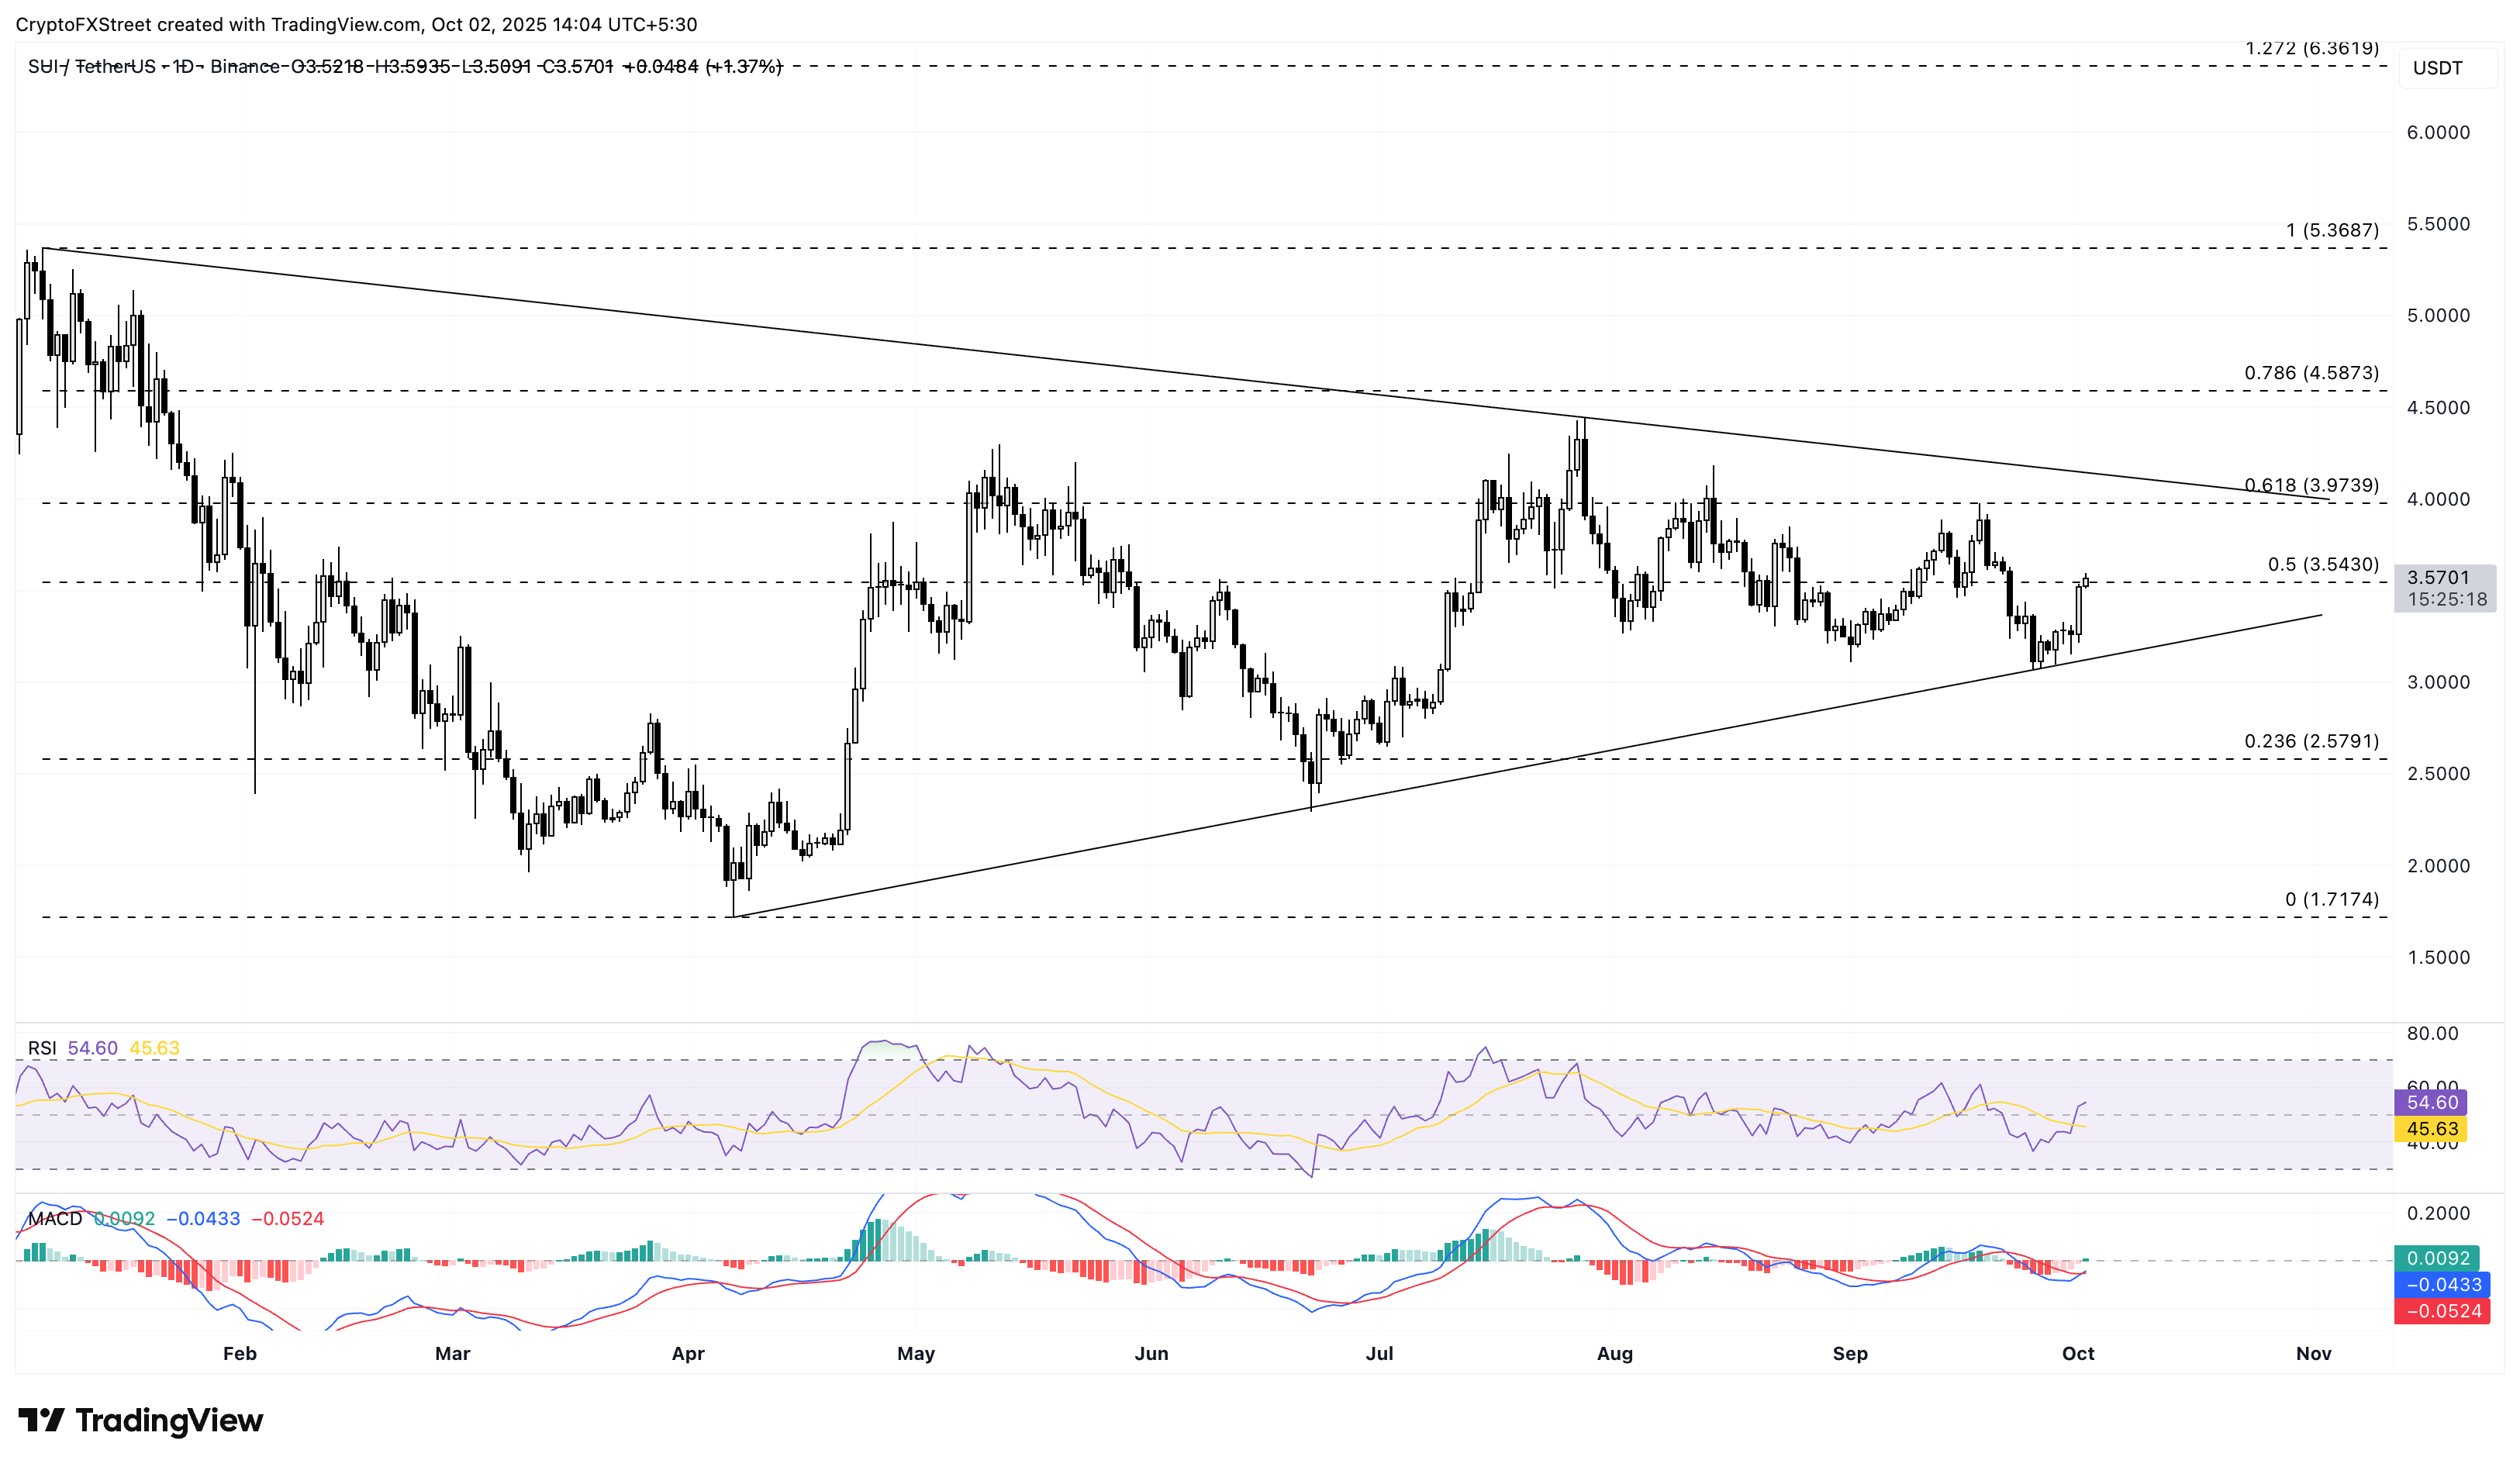
SUI/USDT daily price chart.

On the flip side, a reversal from $3.5430 could retest the support trendline at $3.1500. 

Disclaimer: For information purposes only. Past performance is not indicative of future results.
placeholder
Gold Price Analysis Today | Forex Gold Analysis | XAU/USD Analysis - October 15, 2026Get the latest gold price analysis, forex gold insights, and XAU/USD analysis for October 15, 2026. Read on for the details.
Author  Mitrade
Oct 16, Fri
Get the latest gold price analysis, forex gold insights, and XAU/USD analysis for October 15, 2026. Read on for the details.
placeholder
The Fed will sit still on October 28 — but 100 of 100 economists now expect a December hikeA Reuters poll run October 16-20 found 94 of 100 economists expecting the Fed to hold at 3.75-4.00% on October 28 — and all 100 expecting a hike in December, against less than half a month earlier. The market is close to the same price, with CME FedWatch at roughly 17% for October and 82.8% for December. With the Fed in blackout since October 17, here are the five dates that decide the rest of the year, what each one is priced for, and the two directions each can take.
Author  Irene Q.
Oct 22, Thu
A Reuters poll run October 16-20 found 94 of 100 economists expecting the Fed to hold at 3.75-4.00% on October 28 — and all 100 expecting a hike in December, against less than half a month earlier. The market is close to the same price, with CME FedWatch at roughly 17% for October and 82.8% for December. With the Fed in blackout since October 17, here are the five dates that decide the rest of the year, what each one is priced for, and the two directions each can take.
placeholder
Gold Price Analysis Today | Forex Gold Analysis | XAU/USD Analysis - October 26, 2026Get the latest gold price analysis, forex gold insights, and XAU/USD analysis for October 26, 2026. Read on for the details.
Author  Mitrade
13 hours ago
Get the latest gold price analysis, forex gold insights, and XAU/USD analysis for October 26, 2026. Read on for the details.
placeholder
Gold breaks $4,000 as oil becomes the inflation problem — $3,943 is the line that mattersSpot gold closed at $3,995.6 on October 23, down about 4.1% for the week and at its lowest since mid-July, and traded near $3,988 on October 26 even as Brent crude settled at $116.72 and Middle East supply risk stayed elevated. The war premium stopped working because oil is now the inflation trade: December Fed hike odds are 68.9% and the 10-year yield is 4.988%. Here are the three numbers, the transmission chain, and the July low at $3,943 that decides whether this is a bottom or a bigger correction.
Author  Irene Q.
8 hours ago
Spot gold closed at $3,995.6 on October 23, down about 4.1% for the week and at its lowest since mid-July, and traded near $3,988 on October 26 even as Brent crude settled at $116.72 and Middle East supply risk stayed elevated. The war premium stopped working because oil is now the inflation trade: December Fed hike odds are 68.9% and the 10-year yield is 4.988%. Here are the three numbers, the transmission chain, and the July low at $3,943 that decides whether this is a bottom or a bigger correction.
placeholder
Bitcoin Price Forecast: Drops Below $80,000 in Fifth Straight Loss, May Test $75,000 as FOMC Meeting Approaches Bitcoin falls below the $80,000 mark as the October FOMC decision approaches, threatening a further dip toward $75,000.On October 26, Bitcoin (BTC) again lost the key psychological mark o
Author  TradingKey
4 hours ago
Bitcoin falls below the $80,000 mark as the October FOMC decision approaches, threatening a further dip toward $75,000.On October 26, Bitcoin (BTC) again lost the key psychological mark o
goTop
quote