Jito price could hit $6 as JTO coils up inside this bullish pattern

Source Fxstreet
  • Jito price action shows a potential cup and handle formation.
  • Based on theoretical measurement rules, a successful breakout could yield a 56% rally to $6.0. 
  • A breakdown of the $3.86 support level would create a lower low for JTO and invalidate the bullish thesis. 

Jito (JTO) price has been on an uptrend since forming a local bottom in early January. Since then, JTO has revisited the key swing point formed in early December, suggesting the bulls’ intention to move higher.

Also read: Top 3 Price Prediction Bitcoin, Ethereum, Ripple: Retail watches from the sidelines with a bias for shorts

Jito price coils up for an explosive move

Jito price has produced a rounded bottom between December 9, 2023, and March 16, 2024. But the retracement that began after mid-March, hints that this rounded bottom could transform into a bullish pattern termed – cup and handle.

This technical formation contains a rounded bottom called a ‘cup’ followed by a ‘handle’. The handle is a brief, downward trend to the right of the cup's peak. It typically doesn't fall below the bottom of the cup. A trend line drawn connecting the cup and the handle’s peaks is key for tracking a breakout. 

A decisive close above this resistance level forecasts a 56% upswing to $6.0 obtained by measuring the distance between the cup’s peak to the right side and the bottom of the cup and adding it to the breakout point at $3.86.

This move will be interesting to watch, considering it will overcome the $4 and the $5 psychological levels to tag the next one at $6.

Also read: SBF sentenced to 25 years in prison after November conviction
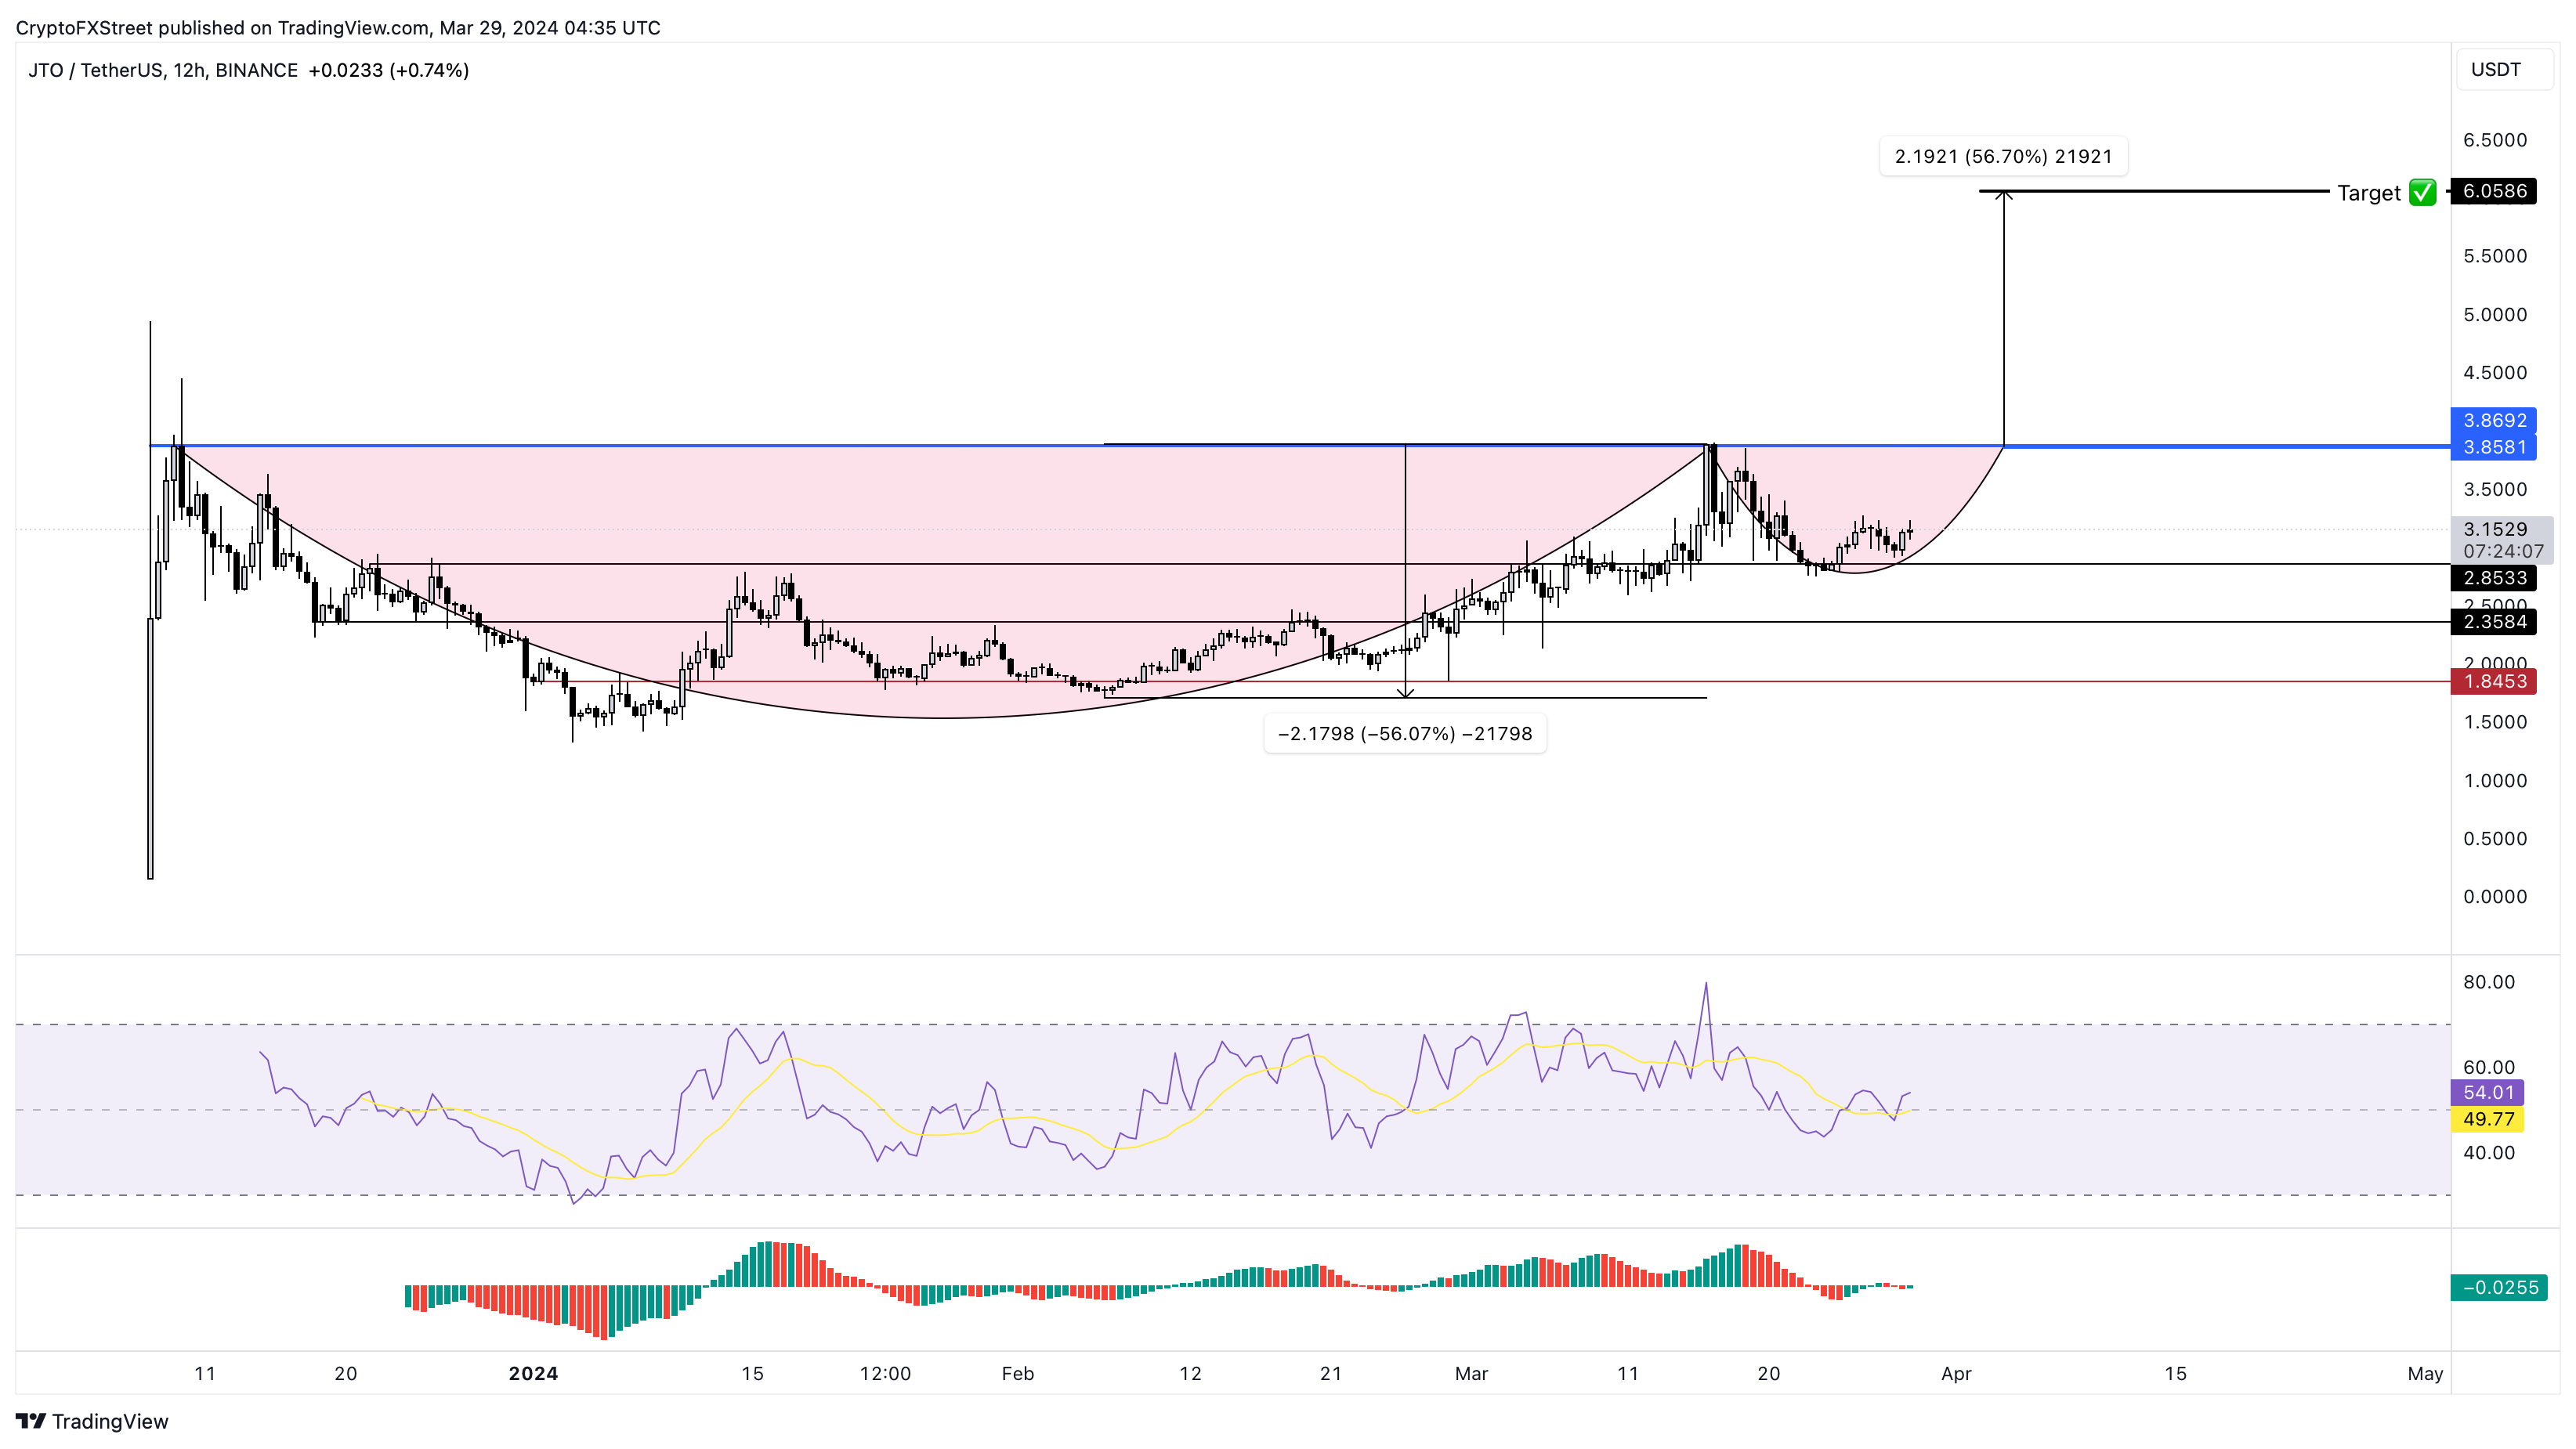
JTO/USDT 12-hour chart

JTO/USDT 12-hour chart

While the outlook for the Jito price looks logical, the confirmation for the cup and handle setup is not here. The cup part of the pattern is yet to form. Beyond that, JTO needs to flip the breakout level at $3.86 to provide confirmation. 

If Bitcoin price triggers a correction, Jito price could slide lower. In such a case, if JTO produces a twelve-hour candlestick close below the $2.85 support level, it would create a lower low and invalidate the bullish thesis. This development could lead to a 17% crash to the next key support level at $2.85.

Disclaimer: For information purposes only. Past performance is not indicative of future results.
placeholder
What Crypto Whales are Buying For May 2025Crypto whales are making bold moves heading into May 2025, and three tokens are standing out: Ethereum (ETH), Artificial Superintelligence Alliance (FET), and Onyxcoin (XCN).
Author  Beincrypto
Apr 21, Mon
Crypto whales are making bold moves heading into May 2025, and three tokens are standing out: Ethereum (ETH), Artificial Superintelligence Alliance (FET), and Onyxcoin (XCN).
placeholder
Analysts Highlight 4 Reasons Why ETH Price Could Rebound Strongly in MayEthereum (ETH) has declined for five consecutive months. However, it enters May with rising optimism.
Author  Beincrypto
May 07, Wed
Ethereum (ETH) has declined for five consecutive months. However, it enters May with rising optimism.
placeholder
Sui Price Forecast: SUI bulls aim for 15% gains as open interest and bullish bets increase among tradersSui (SUI) price extends recent gains, soaring10% higher at the time of writing on Thursday and approaching its key resistance level at $3.65.
Author  FXStreet
May 08, Thu
Sui (SUI) price extends recent gains, soaring10% higher at the time of writing on Thursday and approaching its key resistance level at $3.65.
placeholder
EUR/USD trades below 1.1250, eases due to ECB dovish signalsEUR/USD is retreating from gains posted in the previous session, trading near 1.1240 during Monday’s Asian session.
Author  FXStreet
May 12, Mon
EUR/USD is retreating from gains posted in the previous session, trading near 1.1240 during Monday’s Asian session.
placeholder
BNB Price Forecast: BNB recovery receives boost as trading volume hits $11.35 billion, highest yearly levelBNB (BNB) is extending its recovery, trading around $670 on Tuesday after rebounding from a key level over the weekend. On-chain data and technical outlook suggest a rally ahead as BNB breaks above the symmetrical triangle pattern, with ecosystem trading volume and stablecoin activity surging.
Author  FXStreet
Jun 03, Tue
BNB (BNB) is extending its recovery, trading around $670 on Tuesday after rebounding from a key level over the weekend. On-chain data and technical outlook suggest a rally ahead as BNB breaks above the symmetrical triangle pattern, with ecosystem trading volume and stablecoin activity surging.
goTop
quote