
Dogecoin Price Forecast: DOJE ETF to be launched this week
- Dogecoin price breaks above the symmetrical triangle pattern, signaling a potential bullish move on the horizon.
- Bloomberg’s analyst Eric Balchunas says Dogecoin’s ETF under the ticker DOJE is expected to be launched on Thursday.
- On-chain data and technical analysis suggest a potential continuation of the rally, with a target of $0.311.
Dogecoin (DOGE) price holds steady at around $0.240 at the time of writing on Wednesday after breaking above a symmetrical triangle pattern, favoring a bullish move ahead. Bloomberg’s Senior Exchange-Traded Fund (ETF) analyst, Eric Balchunas, has remarked that a Dogecoin ETF, trading under the ticker DOJE, is expected to be launched on Thursday. On-chain data indicate increased accumulation among holders, with technical analysis targeting the $0.311 mark in the upcoming days.
Will DOJE be the first meme coin ETF?
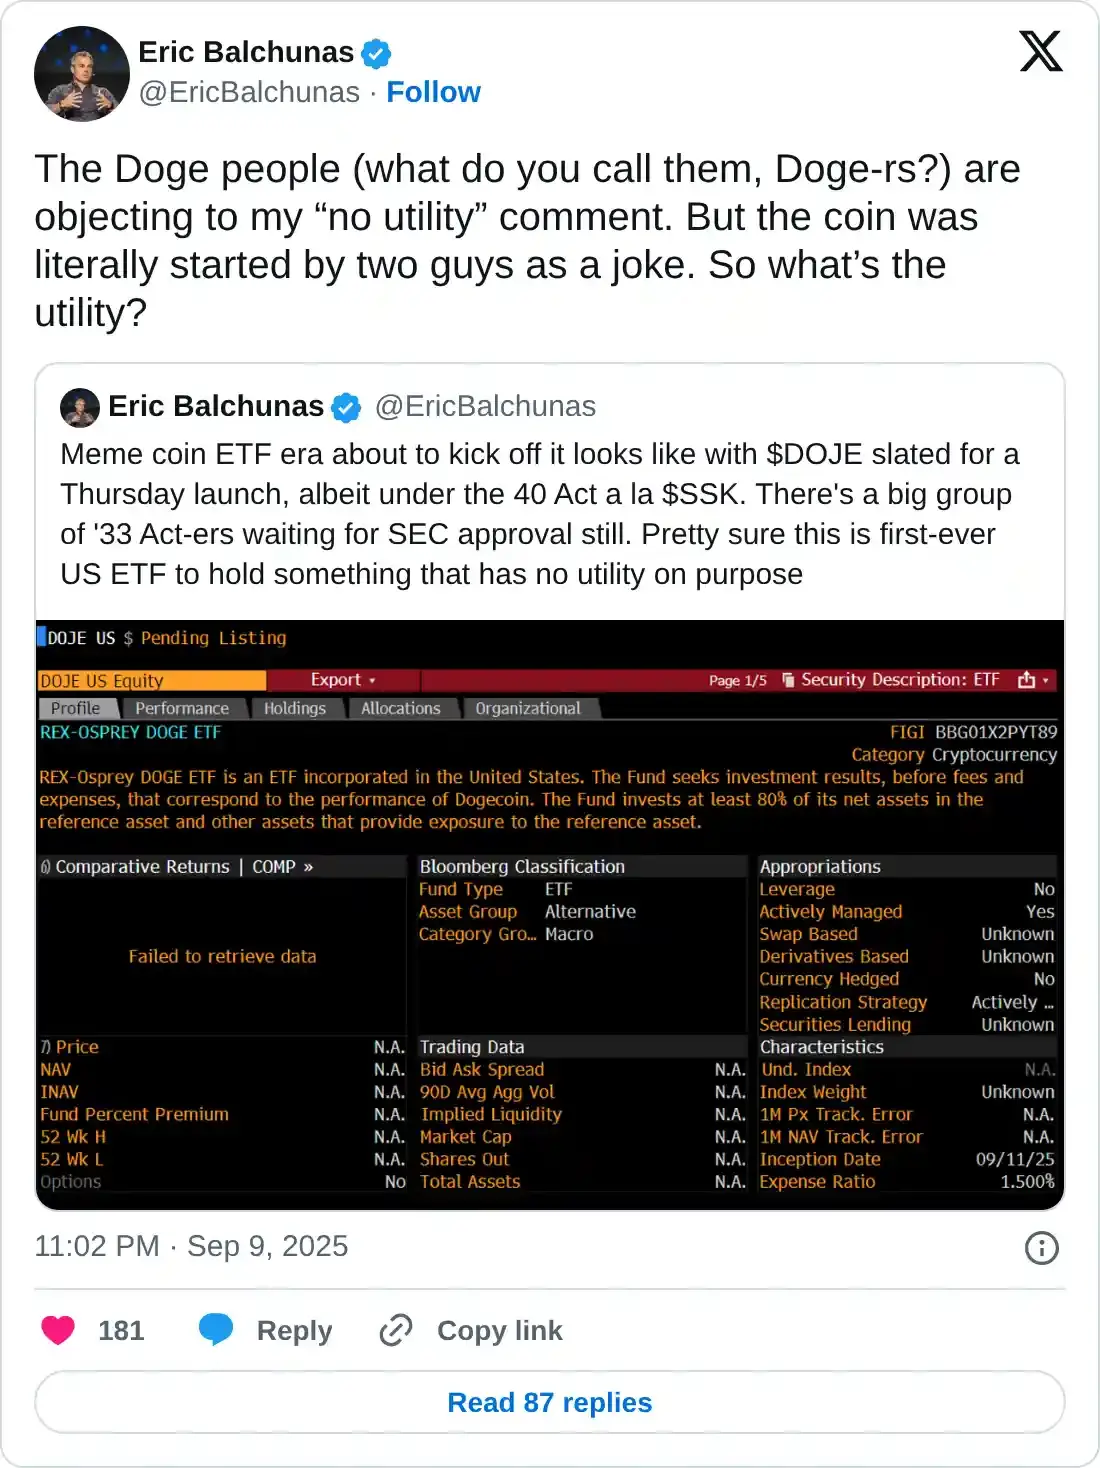
Eric Balchunas, Senior ETF analyst at Bloomberg, posted on his social media X that the “meme coin ETF era about to kick off,” with Dogecoin’s ETF by Rex-Osprey (REX Shares and Osprey Funds) with ticker DOJE is expected to be launched on Thursday.
He added that while many 33 Act filings are awaiting SEC approval, this could be the first US ETF to hold “something that has no utility on purpose.”
He later explained that “The Doge people (what do you call them, Doge-rs?) are objecting to my ‘no utility’ comment. But the coin was literally started by two guys as a joke. So what’s the utility?”
If approved on Thursday, the move would be bullish for the DOGE meme coin in the long term, as an ETF can make it easier for traditional investors to gain exposure to DOGE without needing to purchase and store the cryptocurrency directly. Moreover, approving an ETF could lend more legitimacy to Dogecoin and increase liquidity.
Looking at the on-chain data also supports a bullish outlook for the DOGE meme coin. Santiment’s Supply Distribution data shows that DOGE whales are accumulating tokens.
The metric indicates that whales holding between 100,000 and 1 million (red line), 1 million and 10 million (yellow line), and 10 million and 100 million (blue line) Dogecoin tokens have accumulated a total of 280 million tokens from Sunday to Wednesday, indicating growing confidence among traders.
 [10-1757487191525-1757487191527.34.26, 10 Sep, 2025].png)
Dogecoin supply distribution chart. Source: Santiment
Dogecoin Price Forecast: DOGE poised for a rally after a bullish breakout
Dogecoin price broke above the symmetrical triangle pattern on Monday (formed by connecting multiple highs and lows with two trendlines since mid-July), favoring a bullish move ahead. However, on Tuesday, DOGE faced rejection from the daily resistance level at $0.247, and as of Wednesday, it hovers around $0.240.
If DOGE continues its upward momentum and closes above the $0.247 resistance level, it could extend the rally toward the next daily resistance level at $0.311.
The Relative Strength Index (RSI) reads 59, above its neutral level of 50, indicating bullish momentum. The Moving Average Convergence Divergence (MACD) indicator showed a bullish crossover on Sunday, providing a buy signal. Moreover, it also shows rising green histogram bars above its neutral level, indicating bullish momentum and an upward trend ahead.
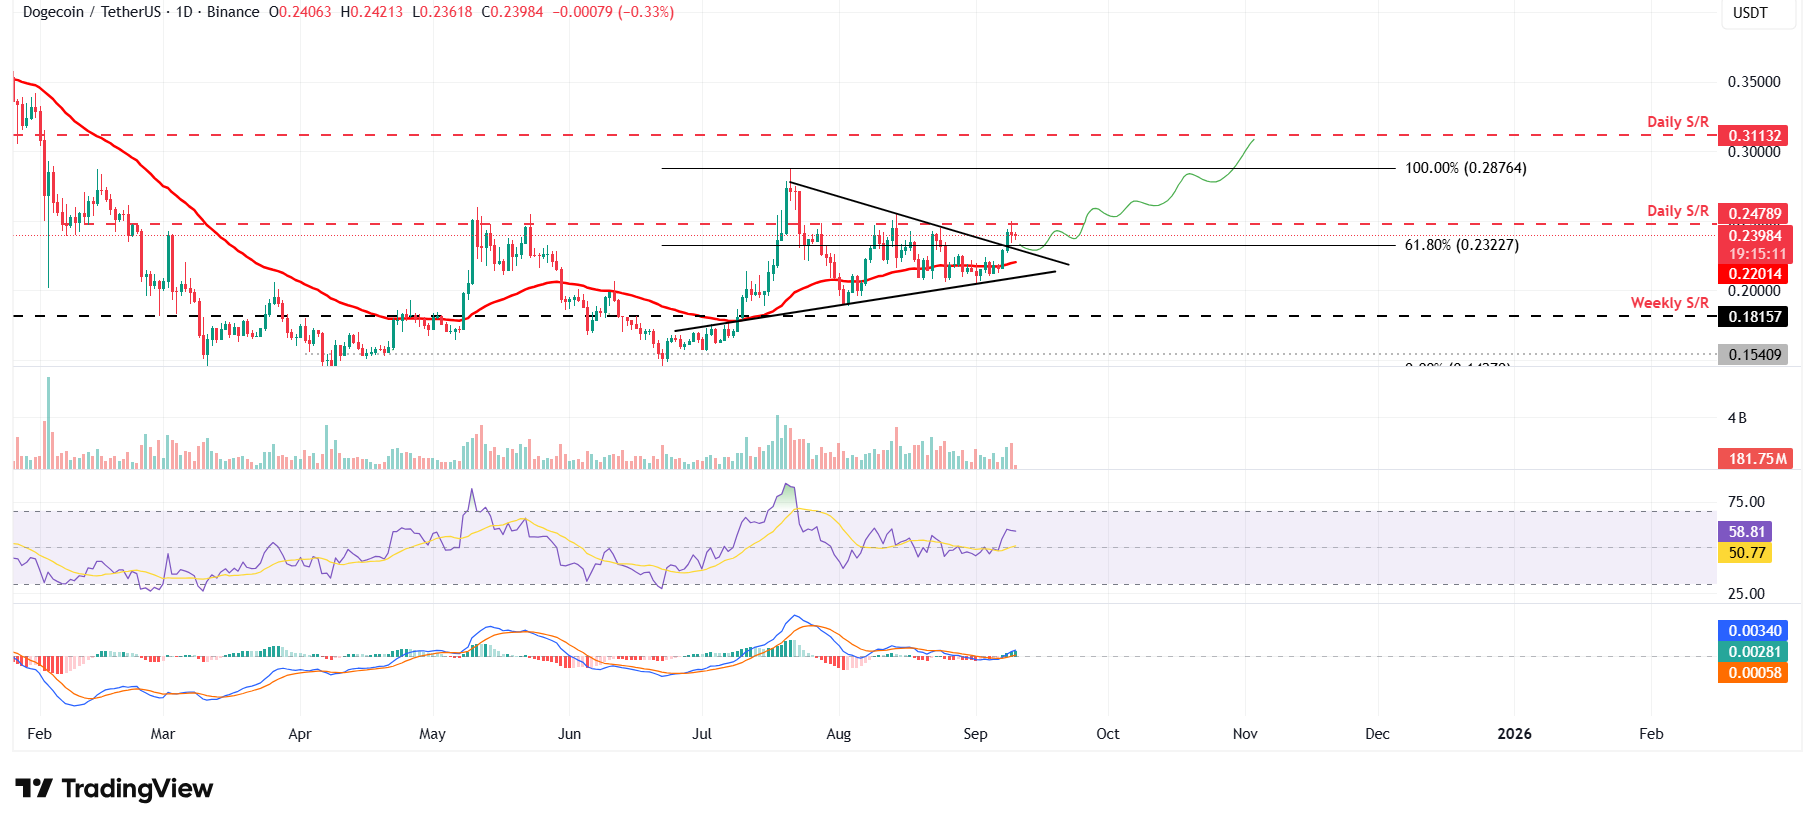
DOGE/USDT daily chart
However, if DOGE faces a correction, it could extend the decline to find support around its 50-day Exponential Moving Average (EMA) at $0.220.
Recommended Articles


