

These four Dogecoin on-chain metrics point to an exponential growth in DOGE price
- Dogecoin price is edging closer to breaching the $0.181 resistance level, hinting at a breakout rally.
- Transaction count, large transactions, and age consumed indicators hint at a potential shift in momentum favoring bulls.
- The MVRV ratio indicates that the short-term outlook is bullish as well.
Dogecoin’s (DOGE) price outlook has been extremely bullish over the past few weeks due to its ascent. As DOGE knocks on a key hurdle, more gains are likely to arrive for the meme coin, several on-chain metrics suggest. On-chain analysis is used to double-check the feasibility of a potential rally for the original dog-based meme coin.
Also read: Can Shib, Doge, Floki and Book of Meme kick-start a rally after Avalanche's meme coin program?
Four Dogecoin on-chain metrics hint at bullish outlook
The four on-chain indicators examined are:
- Transaction Count.
- Age Consumed.
- Market Value to Realized Value (MVRV) ratio.
- Large Transactions.
According to data from Santiment, the spike in Transaction Count suggests that DOGE investors are more active than usual, which means there is demand for the meme coin. This metric spiked from 1.22 billion to 9.20 billion DOGE transactions in a span of 48 hours.
%20[11.37.47,%2027%20Mar,%202024]-638471233133774002.png)
DOGE Transaction Count
Likewise, the Age Consumed indicator also posted a massive uptick during the aforementioned period. Elevated levels of token age hint that a significant amount of previously dormant coins are on the move once again and often point to short-term behavioral shifts among market stakeholders.
Coupled with the Transaction Count metric, the recent increase of the Age Consumed metric is a sign of local bottom formation. The previous spikes in November 2023 and January 2024 have both led to massive uptrends in Dogecoin price.
%20[11.40.09,%2027%20Mar,%202024]-638471233334420752.png)
DOGE Age Consumed
Meanwhile, the 7-day and 30-day Market Value to Realized Value (MVRV) ratios are hovering around 6.62% and 14.38%, respectively, indicating that the unrealized profits are very low. This index is used to calculate investors' average profit/loss for a specific time frame.
A higher MVRV ratio reveals that most holders are sitting on unrealized profits and is considered bearish, as these holders could sell their stack and kick-start a correction. Likewise, a large negative-valued MVRV is theoretically bullish and could signal it is the right moment to accumulate a token.
%20[11.44.20,%2027%20Mar,%202024]-638471233574961377.png)
DOGE 7-day and 30-day MVRV ratio
Based on IntoTheBlock data, the Large Transaction metric is on the rise, showing that whales are interested in the meme coin as well. This indicator acts as a proxy for the number of whales’ and institutional players’ transactions and could indicate their buying behavior.
Based on the other metrics, the spike in Large Transactions is a bullish indicator and hints at a potential rally for Dogecoin price.
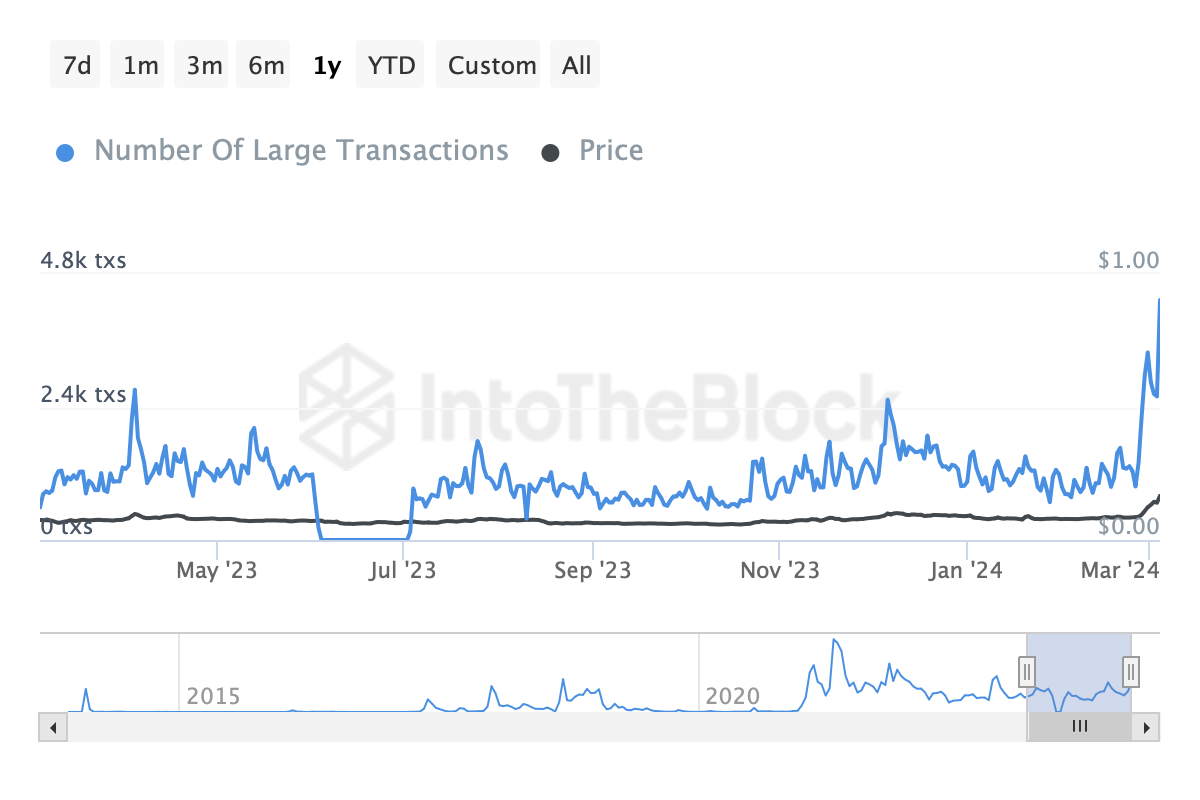
DOGE Large Transaction
On a separate note, technicals suggest DOGE is close to breaching the $0.181 weekly resistance level. If the meme coin bulls are successful, it could kickstart a 52% upswing to the next key hurdle at $0.279. Beyond this level, momentum could easily propel DOGE higher or at least keep the meme coin stable.
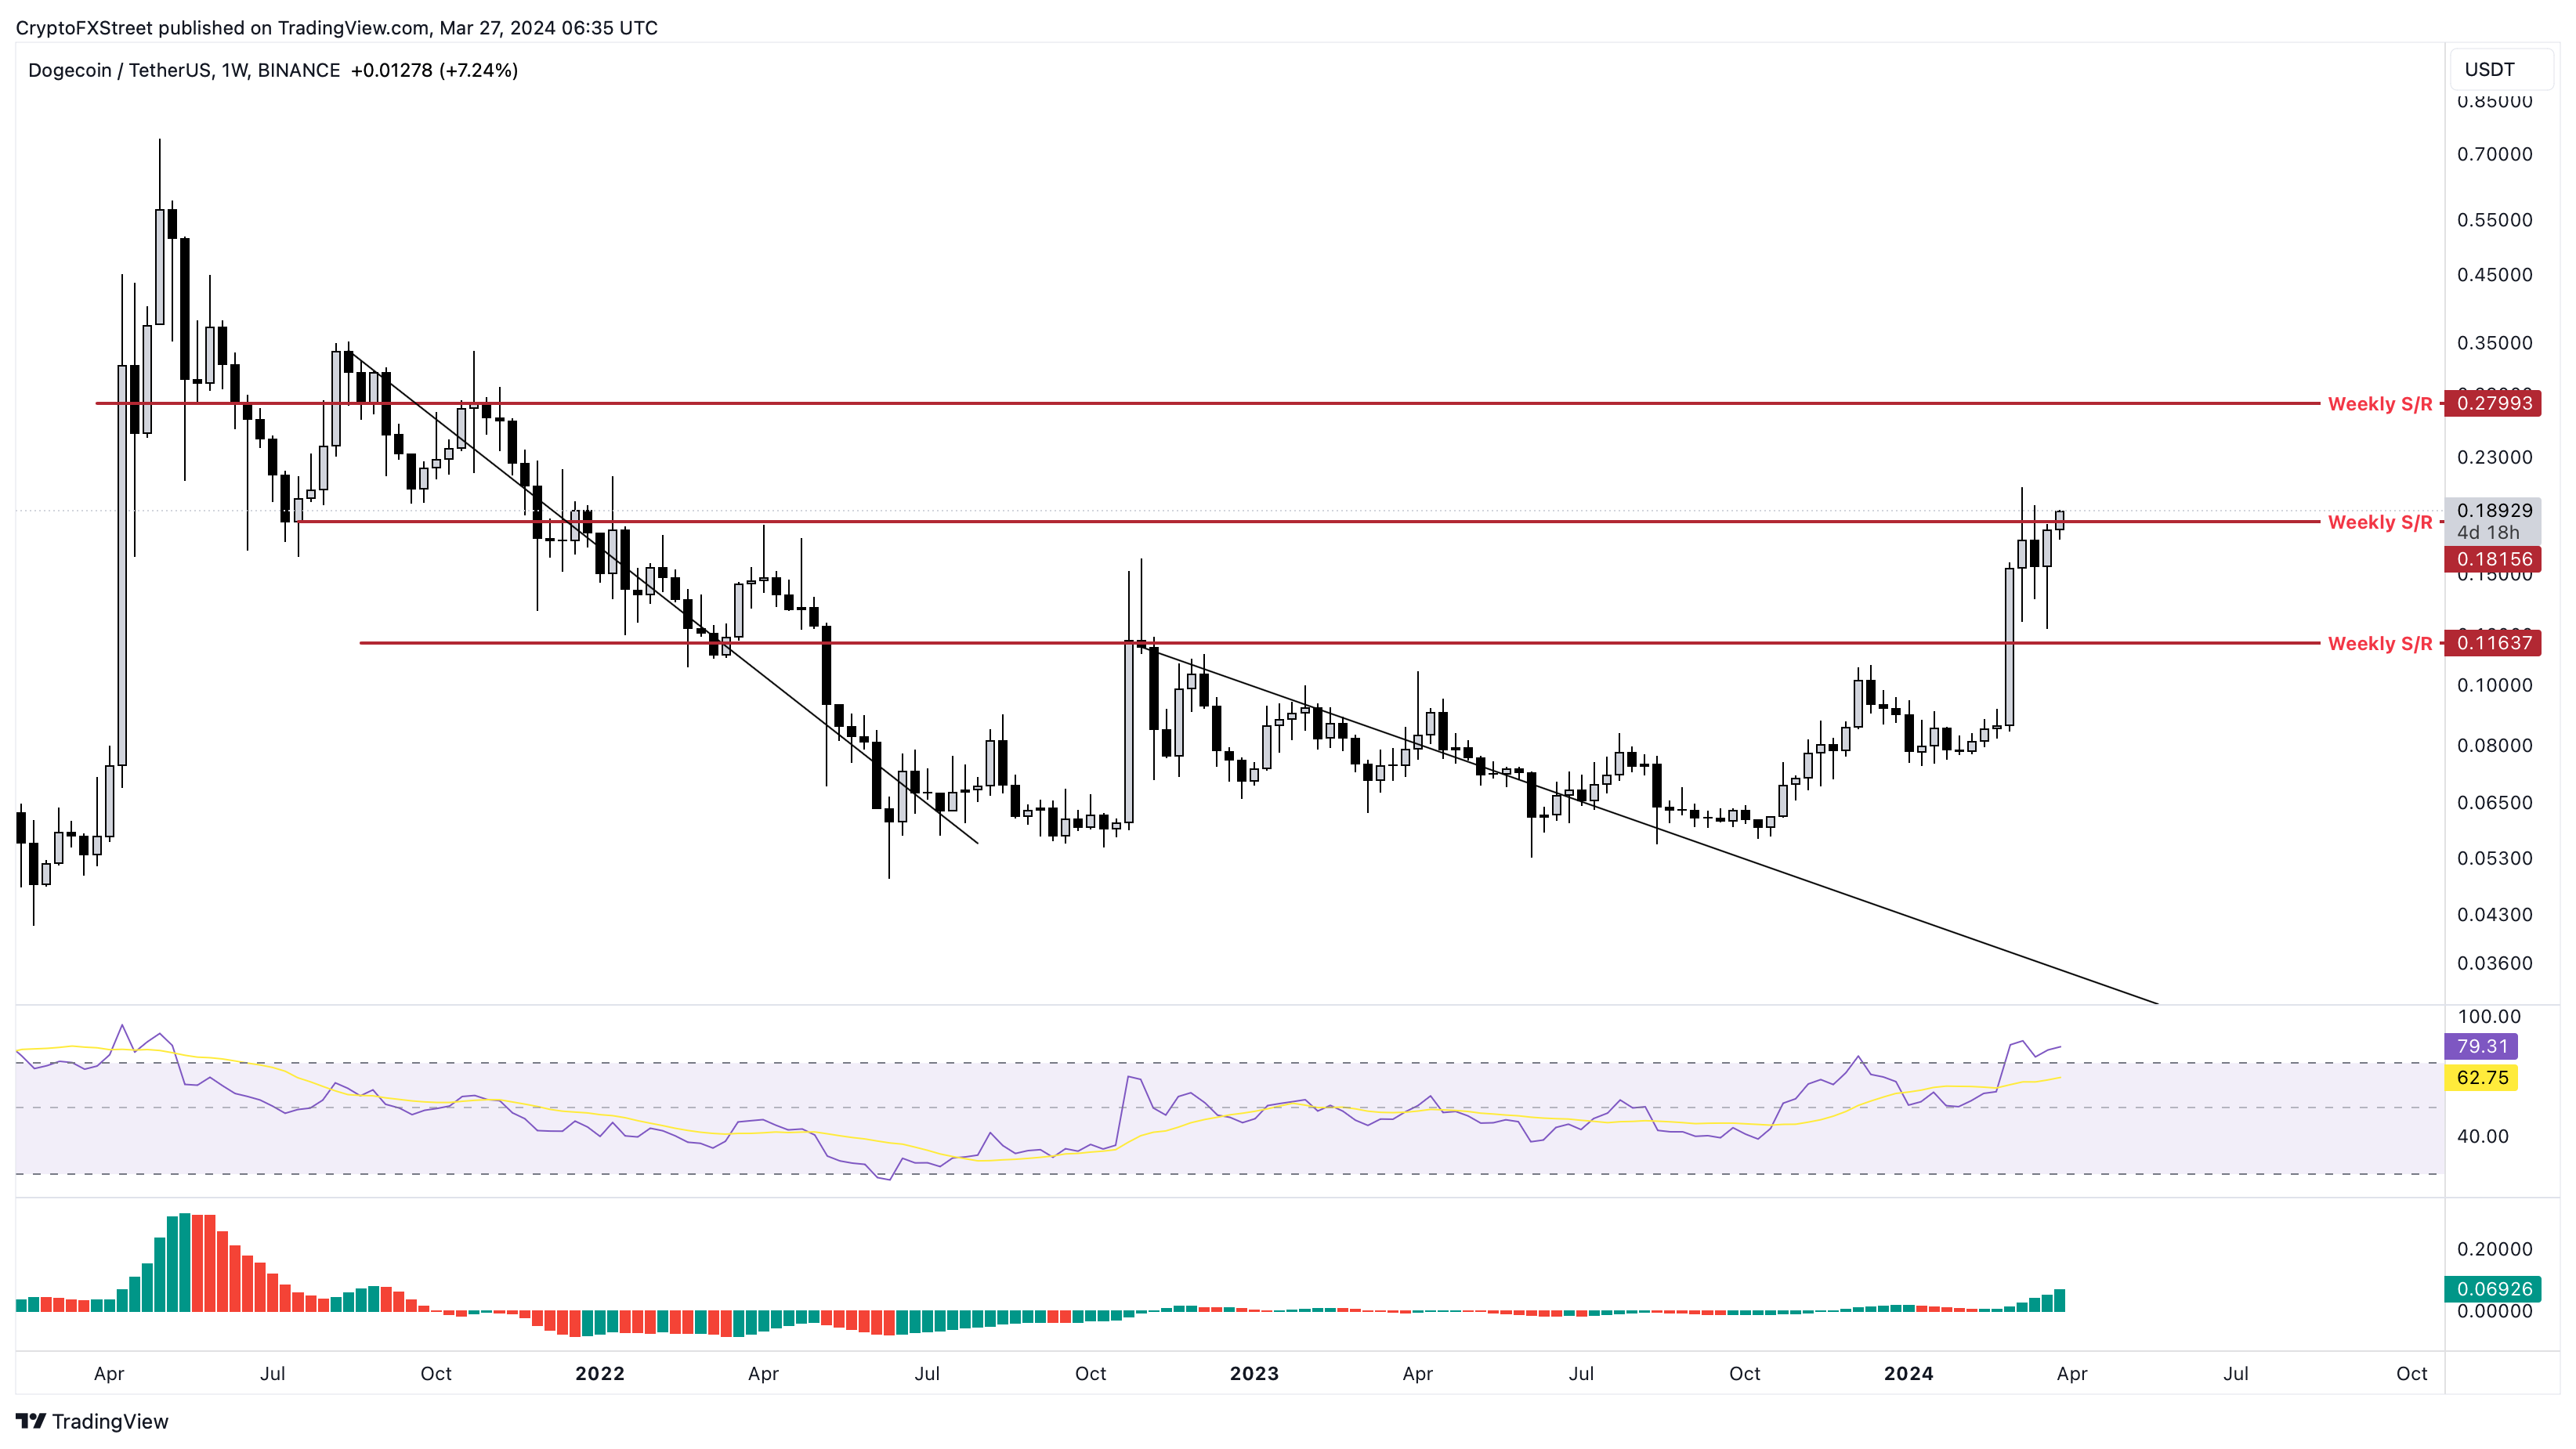
DOGE/USDT 1-week chart
All in all, the Dogecoin price looks primed for a quick rally from both an on-chain and technical perspective.
Recommended Articles


