

Crypto Gainers: Cronos, Kaia, and Raydium extend gains as bullish momentum holds
- Cronos extends the bullish run fueled by Trump Media’s plan to create a CRO treasury company.
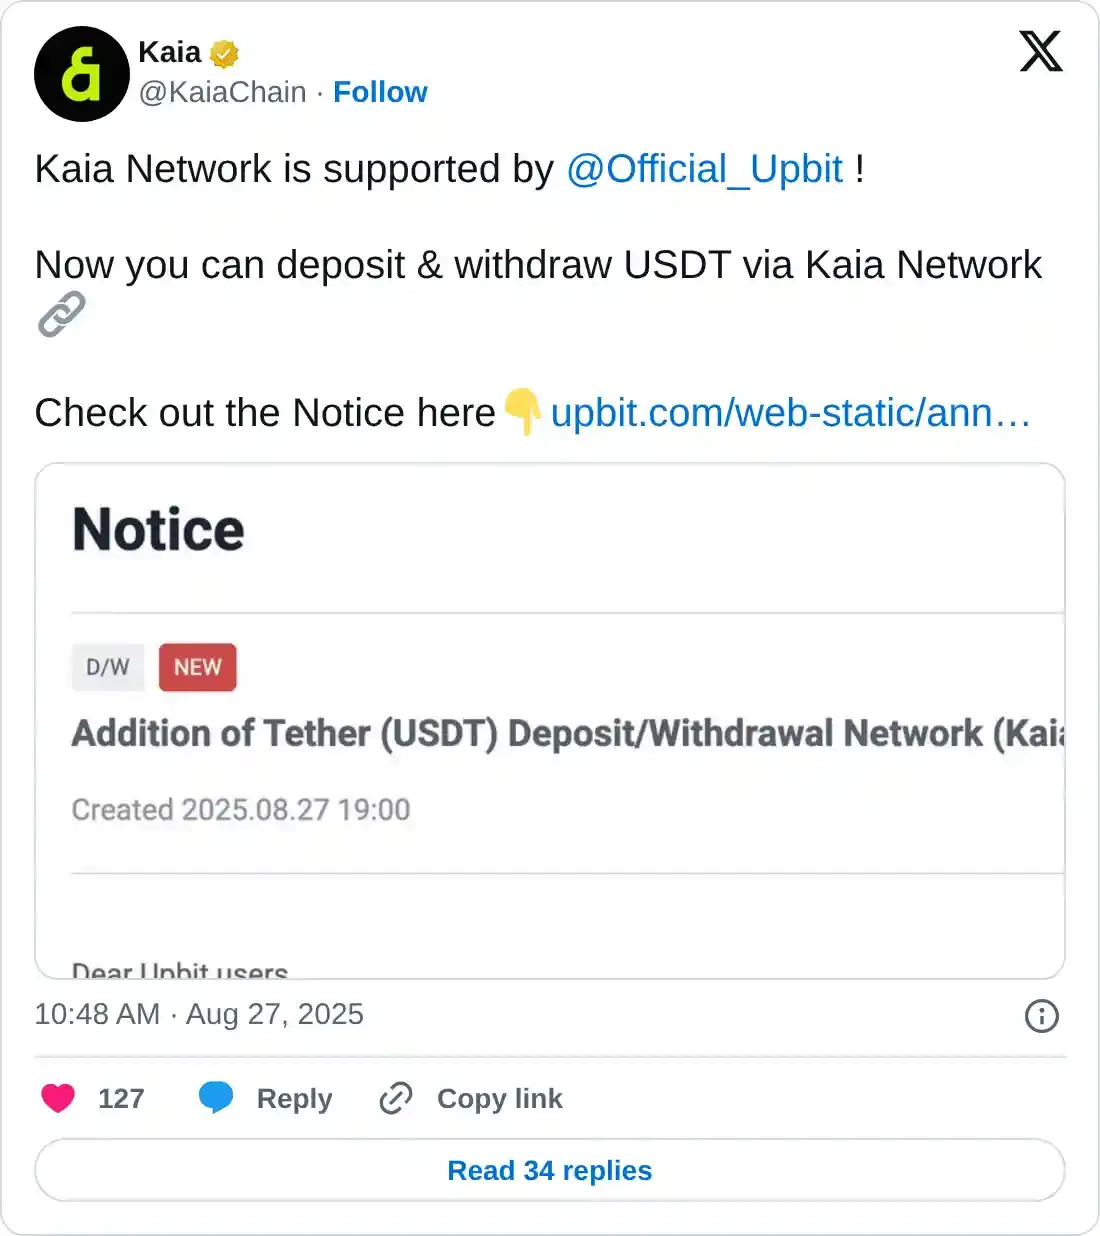
- Kaia edges higher by 7%, extending the 7% rise from Wednesday, underpinned by Upbit’s adoption.
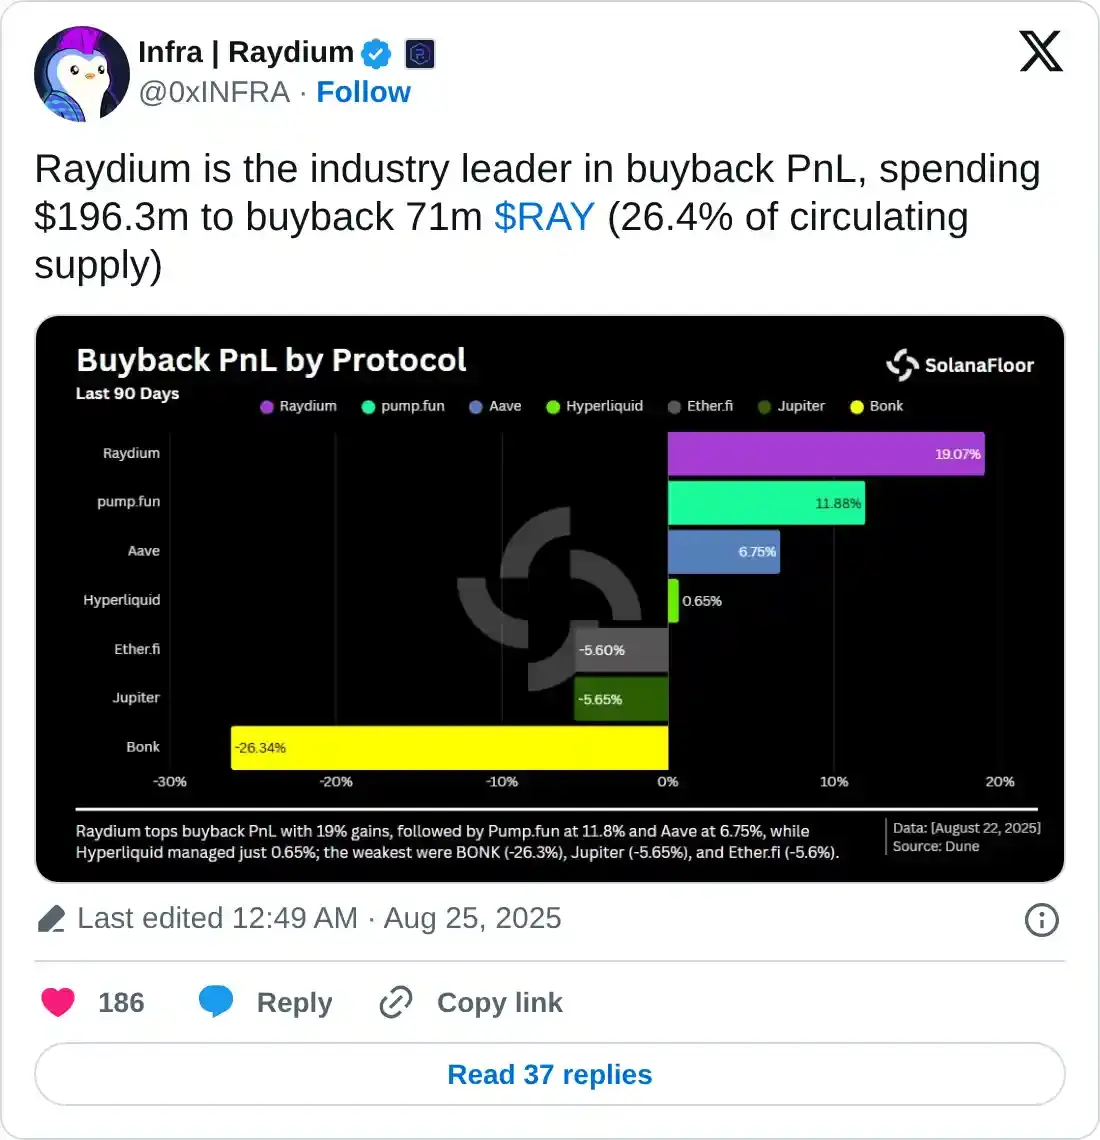
- Raydium extends the uptrend for the third consecutive day, driven by a 71 million token buyback.
Cronos (CRO), Kaia (KAIA), and Raydium (RAY) are the top performers in the cryptocurrency market over the last 24 hours. Cronos extends the rally fueled by the Trump Media and Crypto.com partnership for a CRO treasury company. The adoption of Kaia Chain for USDT transactions by the South Korean exchange Upbit drives the recovery run in KAIA. Raydium, under its recent buyback policy, has reacquired 71 million RAY tokens, resulting in a 26% decline in circulating supply and boosting demand.
CRO hits a new annual high with bulls eyeing $0.50
Cronos extends the bullish trend by 35% at press time on Thursday, crossing the $0.3500 level last seen in May 2022. The uptrend targets the 1.618 Fibonacci retracement level at $0.5058, which is derived from the high of $0.2353 on November 11 to the low of $0.0682 on February 28.
A decisive close above the 1.272 Fibonacci retracement at $0.3295 would increase the chances of an extended rally to the $0.5058 level.
The momentum indicators on the daily chart suggest heightened bullish momentum as the Moving Average Convergence Divergence (MACD) and its signal line scale up. Furthermore, the Relative Strength Index (RSI) stands at 90, edging higher within the overbought zone, indicating increasing buying pressure.
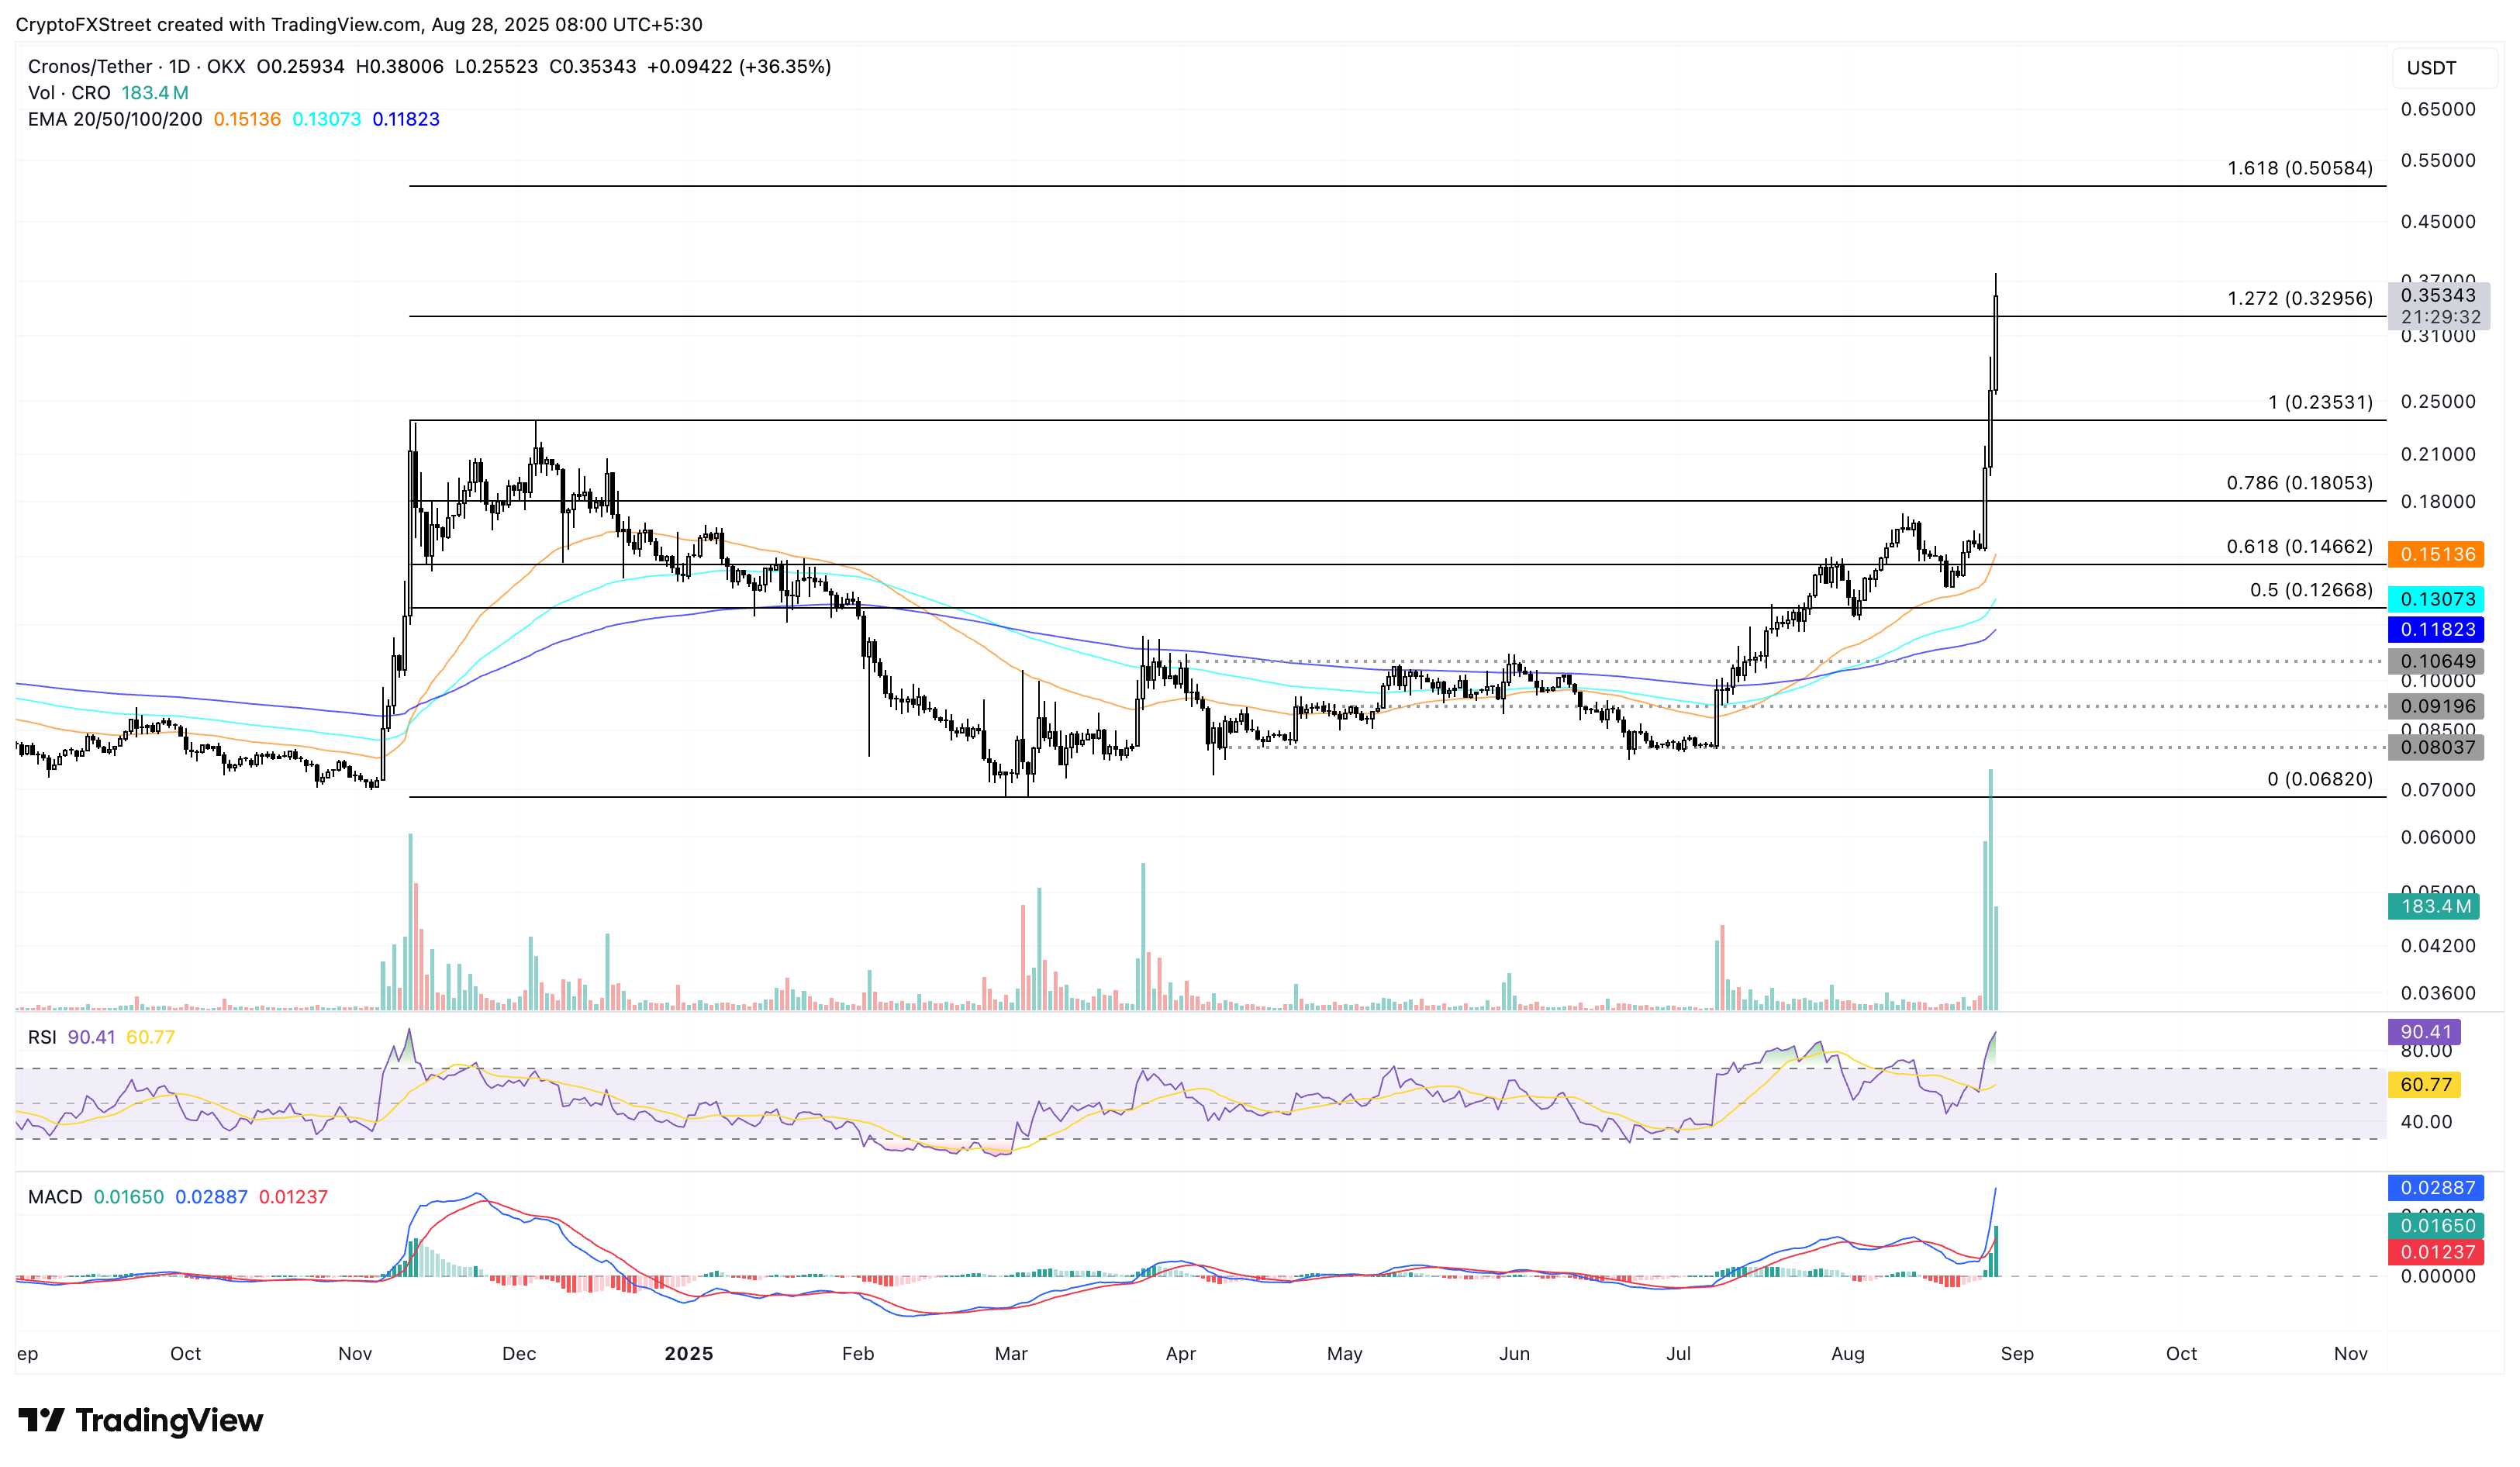
CRO/USDT daily price chart.
On the flip side, a potential reversal below the $0.3295 level could retest the $0.2353 peak from November 11.
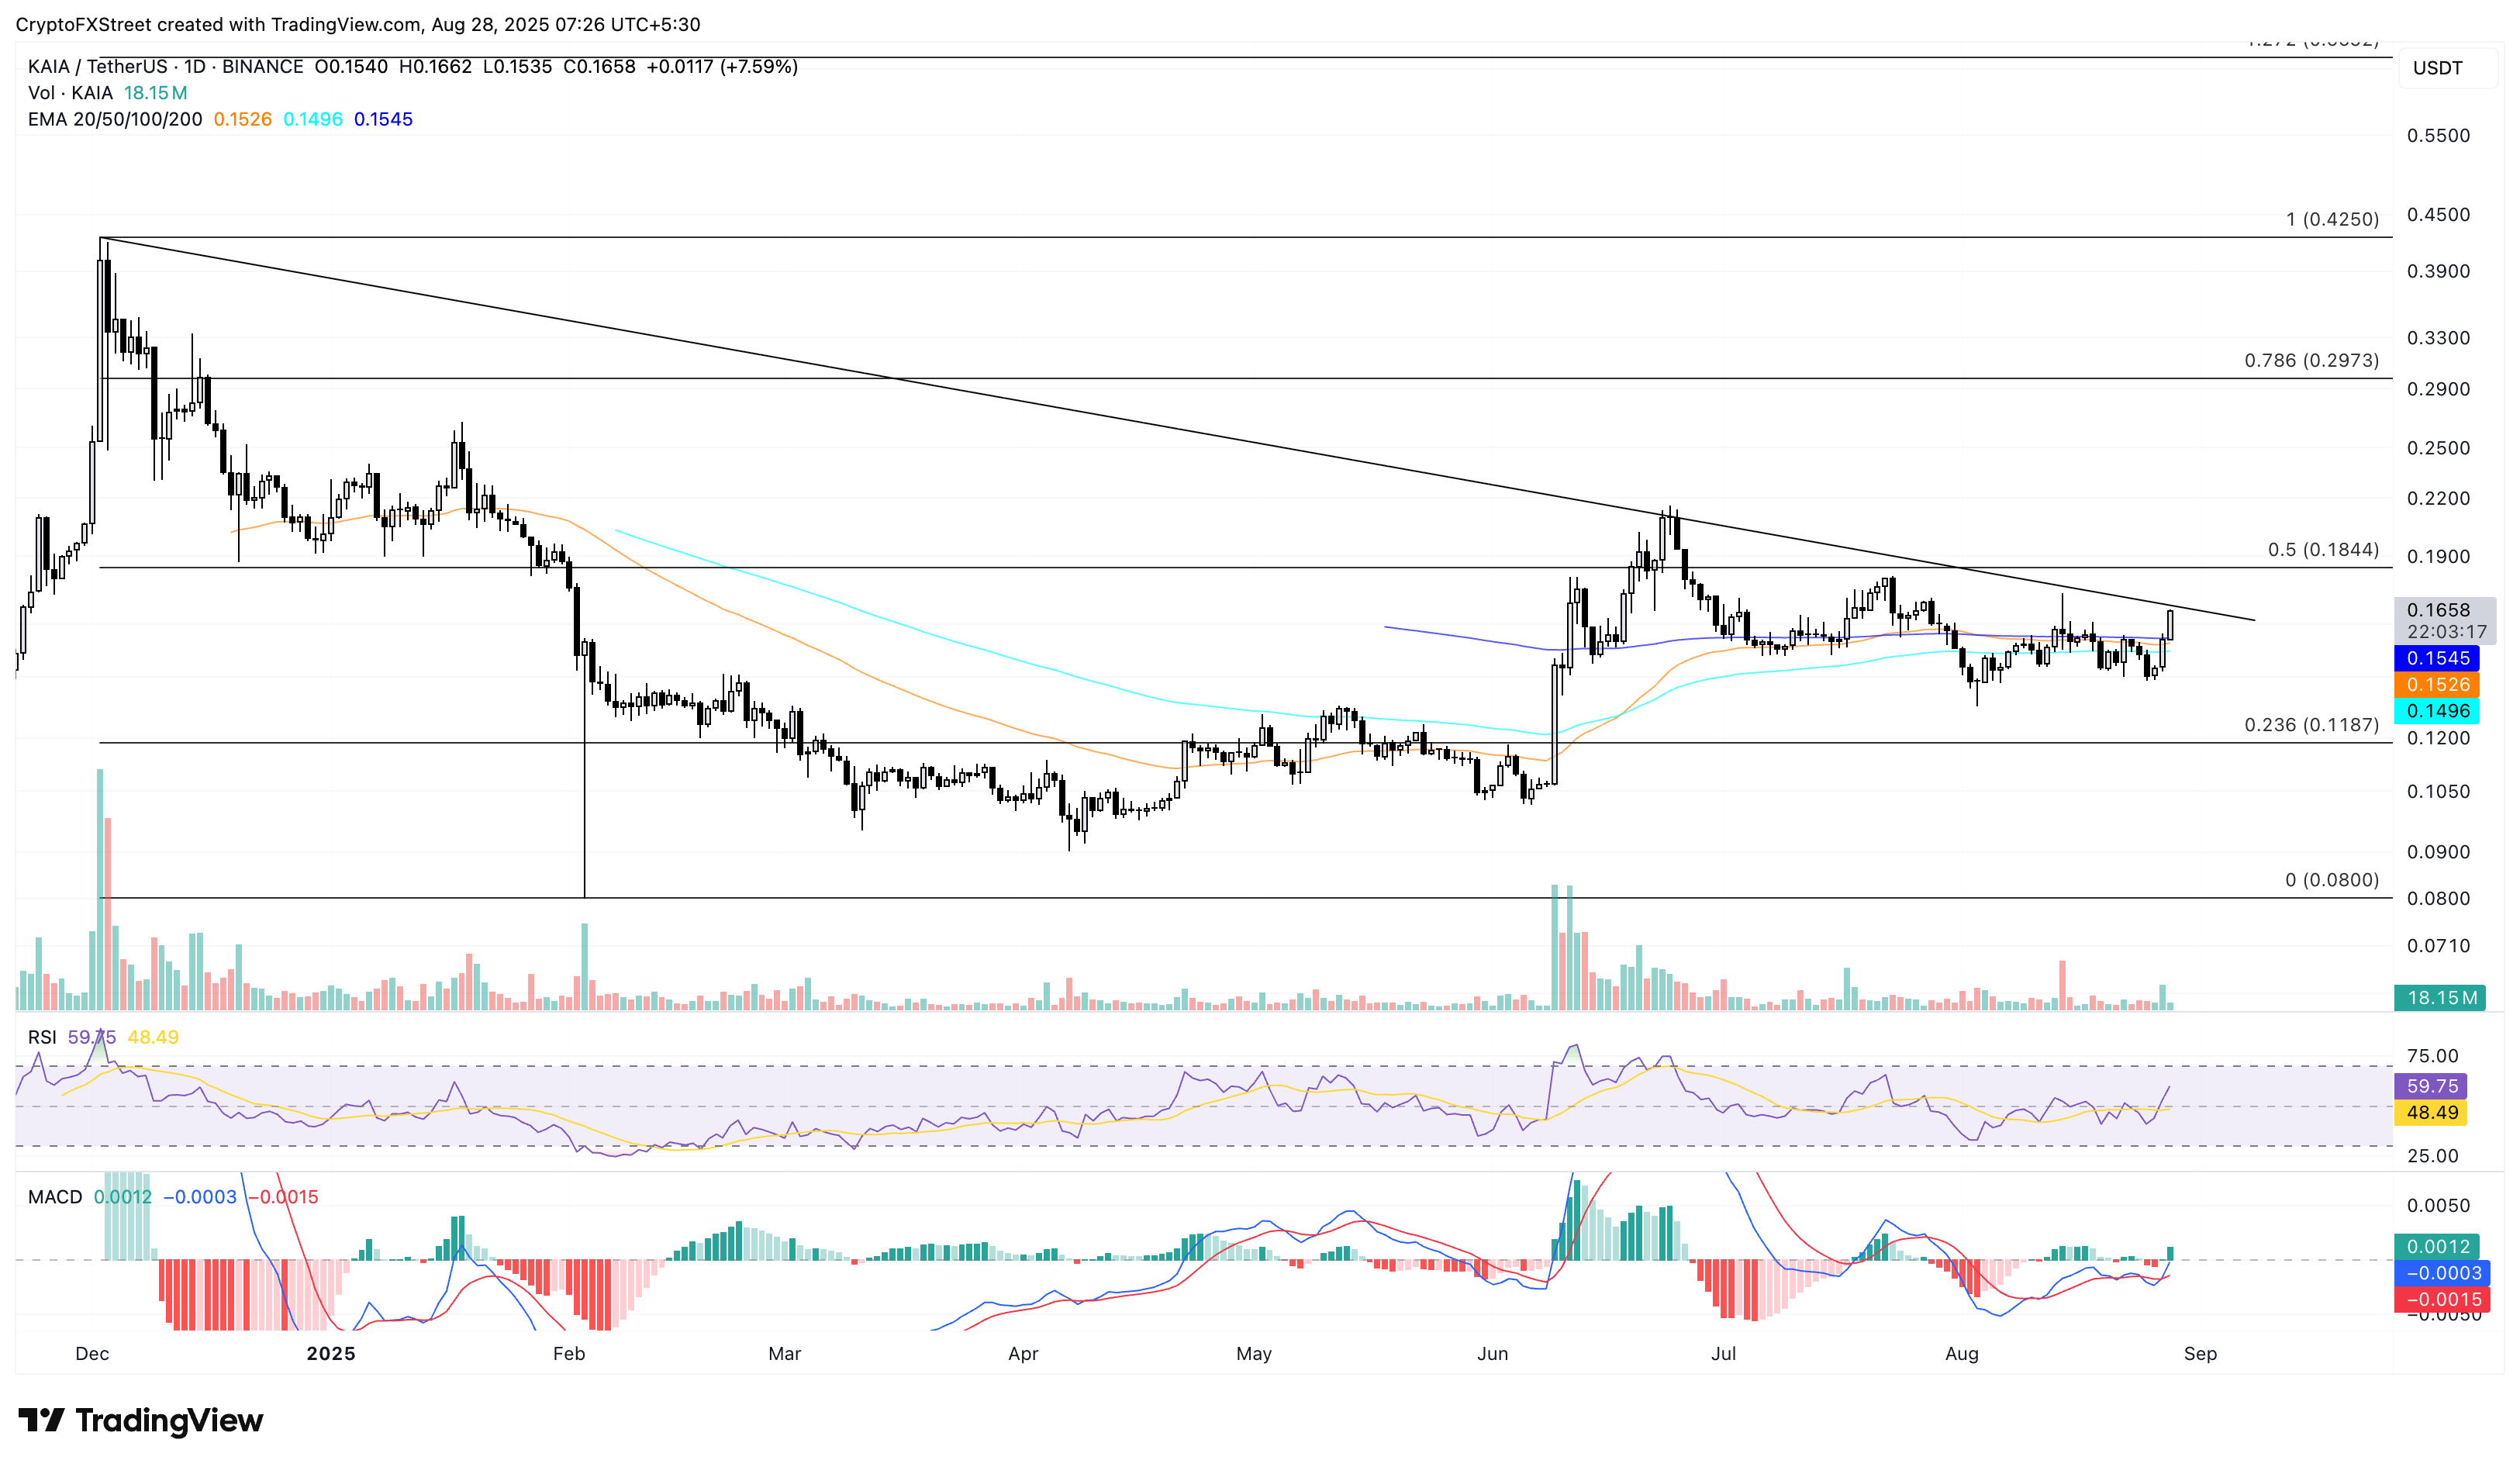
KAIA gains momentum with the Upbit adoption
Kaia edges higher by over 7% at press time on Thursday, challenging an overhead resistance trendline on the daily chart (shared below). The uptrend is underpinned by Kaia Chain’s adoption by the South Korean exchange Upbit, enabling USDT transactions for its users.
Driven by the adoption, KAIA could mark a decisive close above this resistance trendline at $0.1670. Based on the Fibonacci retracement from $0.4250 on December 2 to $0.0800 on February 3, the trendline breakout run could target the 50% retracement level at $0.1844.
The momentum indicators suggest a recovery in buy-side dominance on the daily chart as the MACD crosses above its signal line, signaling a bullish shift in trend momentum. Furthermore, the RSI at 59 spikes above the midpoint line, indicating a rise in buying pressure.
KAIA/USDT daily price chart.
Looking down, if KAIA reverses from the resistance trendline, it could retest the $0.1500 psychological level.
RAY inches closer to reclaiming the $4.00 mark
Raydium trades at $3.86 at the time of writing, gaining over 7% on the day, with bulls eyeing to reclaim the $4.00 level. The Solana-based protocol enters a recovery period driven by a purchase of nearly 71 million RAY tokens under its recent buyback policy, which has decreased its circulating supply by over 26%. This sharp decrease in available supply has resulted in increased demand.
The recovery run hints at a Golden Cross between the 100- and 200-day Exponential Moving Averages (EMAs), which would signal the short-term trend crushing the prevailing slowdown.
RAY eyes the $4.31 level, aligning with the 61.8% Fibonacci level, which is drawn from the $8.70 high of January 23 to the $1.38 low of April 7.
The RSI at 61 bounces off the halfway line, indicating a rebound in buying pressure. Still, the MACD moves flat, intertwined with its signal line, maintaining a neutral stand.
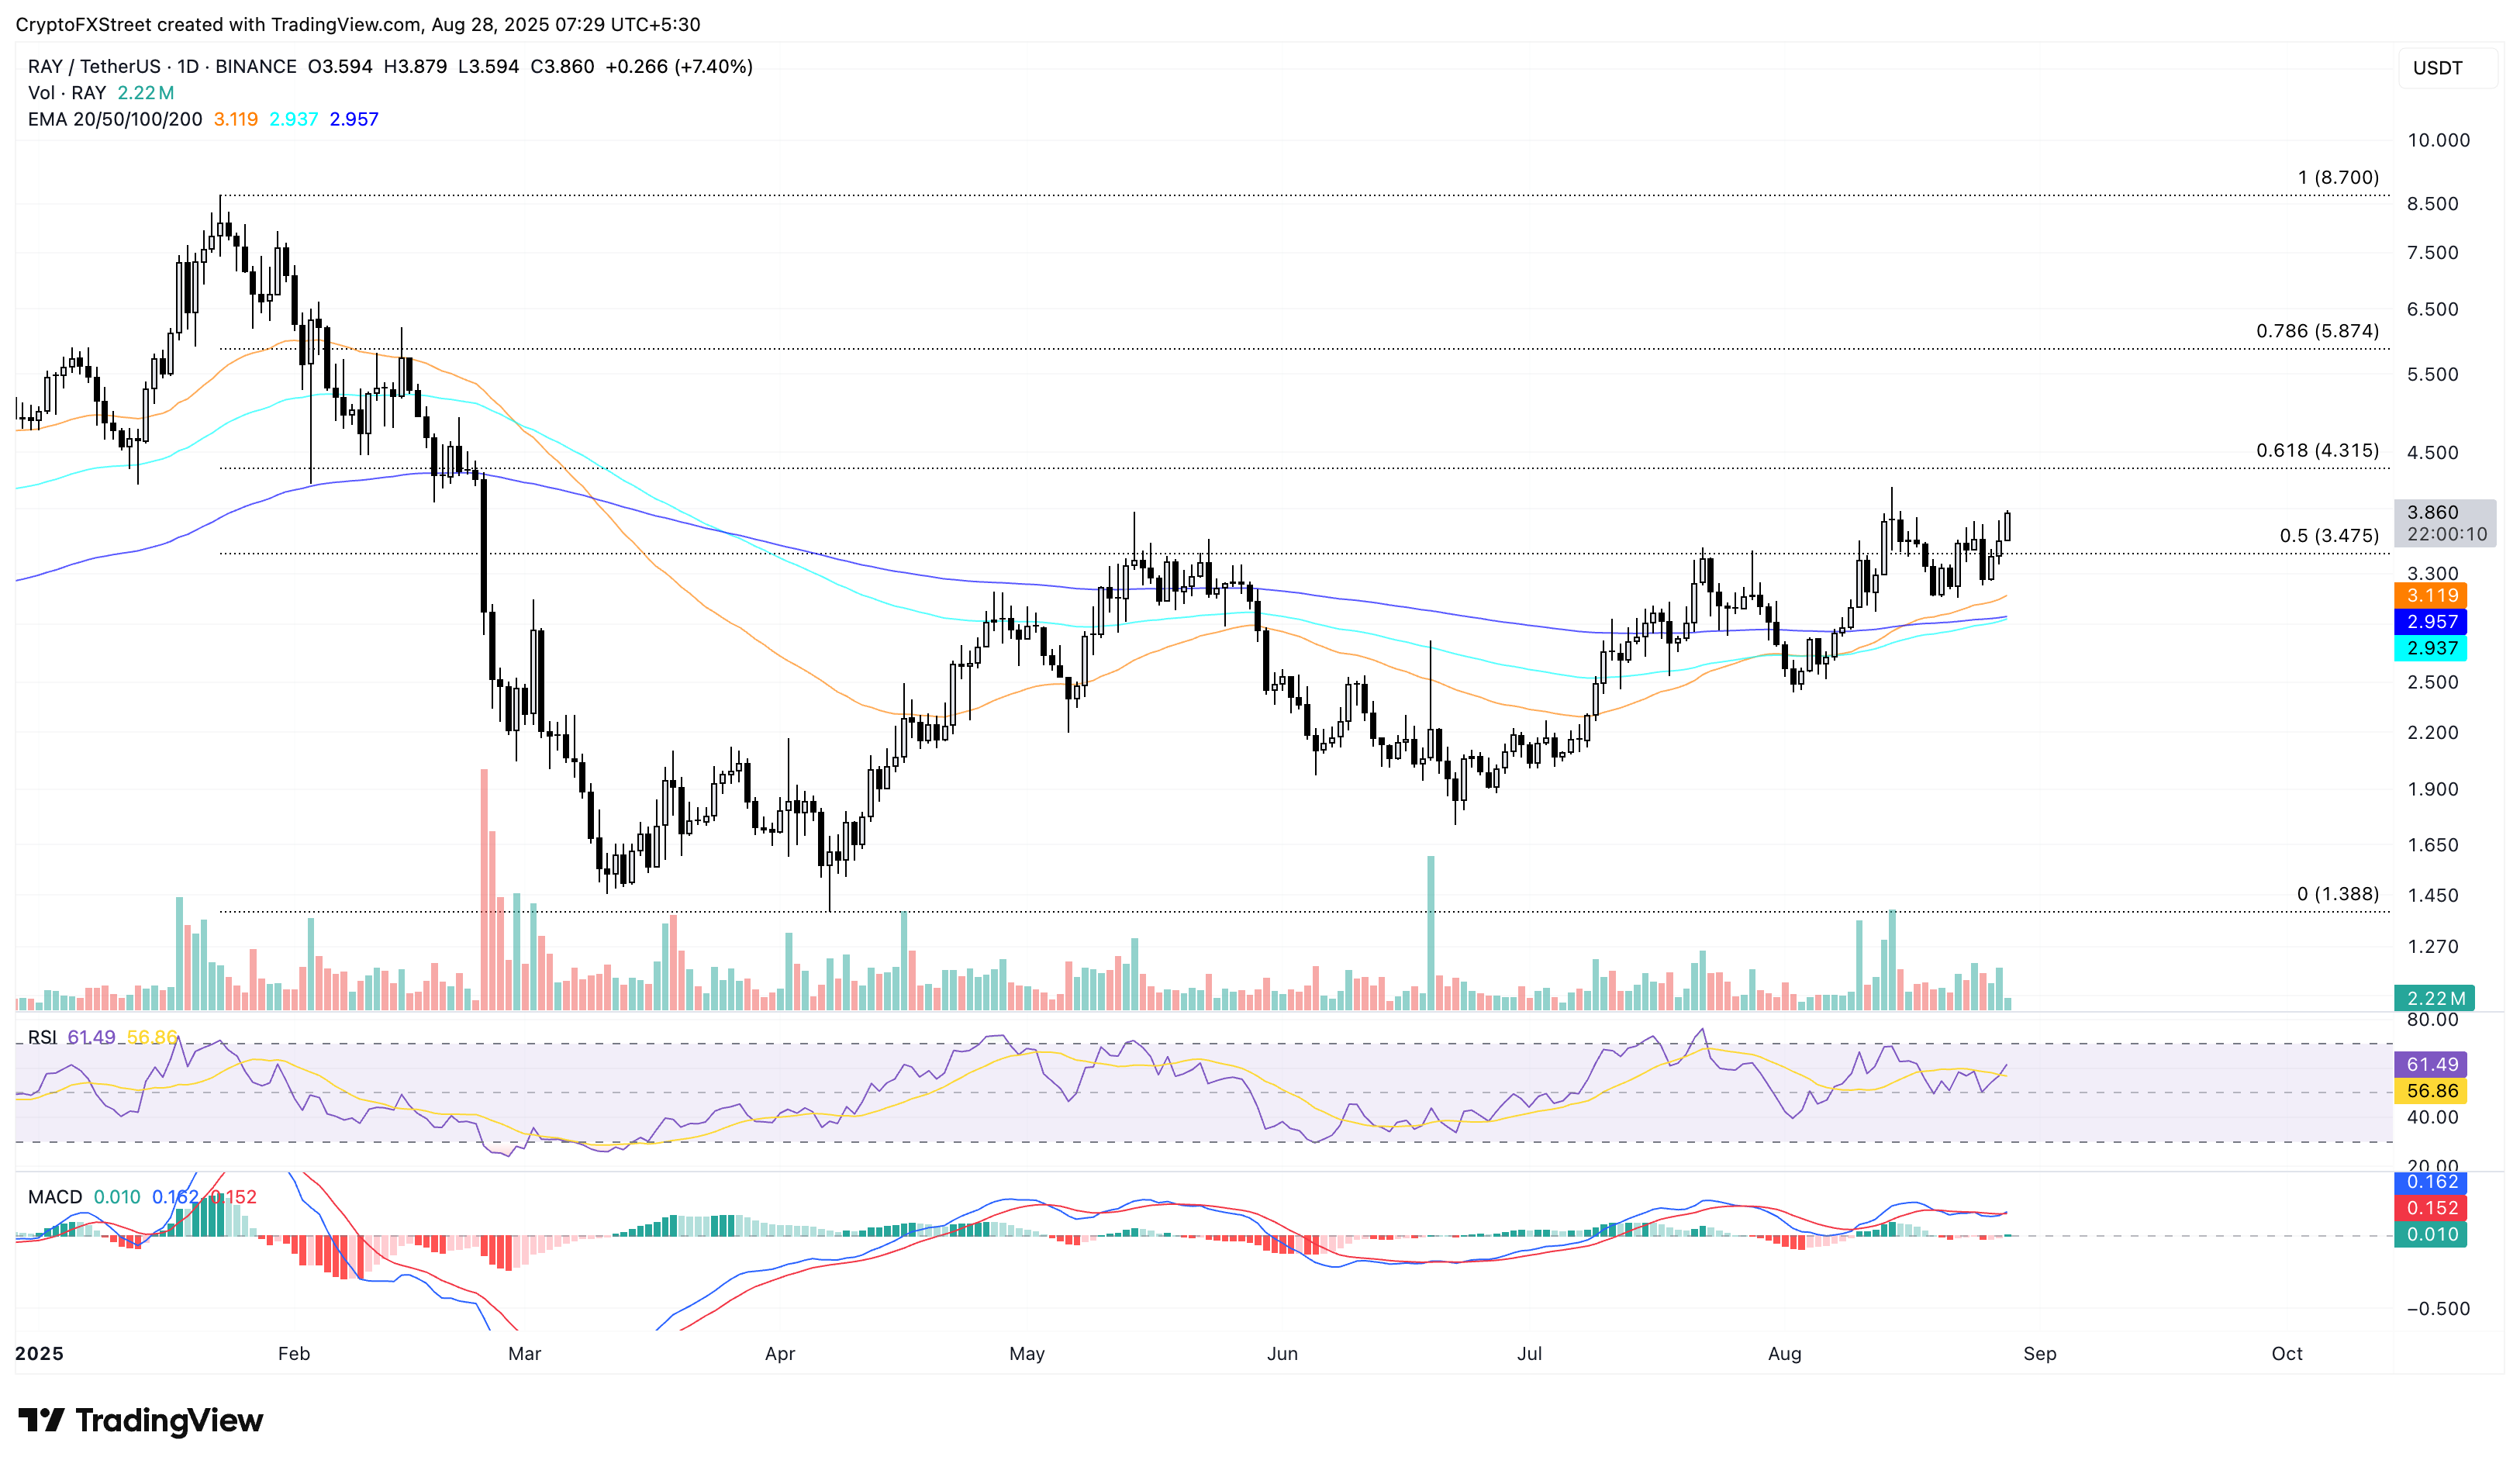
RAY/USDT daily price chart.
If RAY slips below the 50% retracement level at $3.47, it could extend the decline to the 50-day EMA at $3.11.
Recommended Articles


