

Ethereum 4-Week Trend Shows When It Is Time To Sell Everything

Source Newsbtc

Ethereum’s (ETH) latest price rally has sparked renewed debate over whether the market is nearing a critical turning point. Analysts are looking closely at past cycles for insight, with some suggesting that history may be repeating itself. If the patterns hold true, ETH could be only weeks away from a cycle peak, making this a decisive moment for investors to consider when it might be time to sell everything. 

Ethereum’s Cycle Top Signals When To Exit

Crypto analyst Jackis has shared insights into Ethereum’s recent price movements, indicating when investors should exit the market entirely. In a recent X social media post, the analyst noted that the ETH price action is closely mirroring its behavior from previous market cycles. 

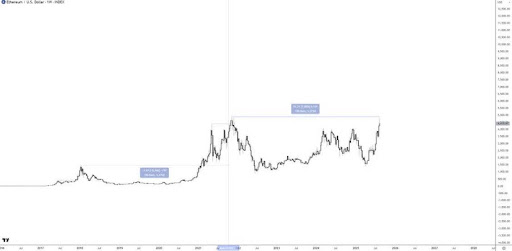
Looking at the chart, Ethereum had hit one of its major cycle tops in January 2018, followed by another peak in November 2021. Moreover, both instances were preceded by a sharp upward trajectory that culminated in heavy corrections. Jackis also points out that in those earlier cycles, ETH was trading significantly above prior highs before topping out. This time, however, the altcoin has not even broken into a new all-time high yet, although it is currently approaching that critical resistance. 

Notably, the timing of ETH’s current setup is significant, as the four-year cycle theory suggests that the cryptocurrency could be just four weeks away from a major top. Jackis noted that this window aligns with September, which could serve as a critical moment for investors to reassess risks and consider whether “selling everything” is warranted. 
Ethereum

The analyst further highlighted that while Ethereum’s structure shows strength, most altcoins are lagging far behind. Cryptocurrencies such as Binance Coin (BNB), XRP, and Dogecoin (DOGE) have already established their tops in 2021 and remain far below those levels. 

Jackie stated that their price action suggests a market environment more consistent with ETH trading around $2,200, rather than its current level below $4,500. Bitcoin, meanwhile, has continued to march higher since its November 2022 lows, forming higher lows and higher highs in a textbook bull market structure.

ETH Panic Selling Or Pre-Breakout Opportunity?

In other news, crypto market expert Ether Wizz argues that the current panic selling of Ethereum mirrors the same mistake traders made with Bitcoin in past cycles. At the time, early sellers underestimated the strength of institutional demand and long-term buyers, only to watch BTC surge far beyond expectations.

The analyst highlighted a recent rebound in the Ethereum price above the 50-week Simple Moving Average (SMA), which historically has signaled the beginning of explosive rallies. The comparison between Ethereum’s 2025 chart and its 2017 breakout also highlights a similarity. In both cases, the cryptocurrency consolidated, reclaimed its moving average, and then accelerated higher.  

Notably, Ether Wizz points out that Ethereum could still experience a short-term correction of 5% to 10%. However, he argues it is misguided to assume ETH has already peaked, maintaining instead that the cryptocurrency is in the early stages of a move that could eventually drive its price toward a new all-time high of $10,000.

Ethereum
Disclaimer: For information purposes only. Past performance is not indicative of future results.
placeholder
US August CPI lands tonight: after a 5.4% PPI shock, will the Fed hike on September 16?US August PPI came in at 5.4% year-on-year, above the 5.3% consensus, with core PPI at 4.6%. Traders have pushed the odds of a 25bp Fed hike on September 15-16 to around 70%. Tonight's CPI is the last major inflation print before the decision — here is the full calendar, the consensus numbers, and what a hot versus cool reading would mean for the dollar, yields, gold and stocks.
Author  Irene Q.
Sep 11, Fri
US August PPI came in at 5.4% year-on-year, above the 5.3% consensus, with core PPI at 4.6%. Traders have pushed the odds of a 25bp Fed hike on September 15-16 to around 70%. Tonight's CPI is the last major inflation print before the decision — here is the full calendar, the consensus numbers, and what a hot versus cool reading would mean for the dollar, yields, gold and stocks.
placeholder
Brent tests $108 as a key export pipeline stays shut — can the rally clear $110?Brent crude rose 2.55% to $106.97 and WTI 2.32% to $102.30 as a major regional export pipeline remained offline with no restart timeline. Front-month backwardation has widened to $5.53 from $3.84 a week ago, European gas is at its highest since December 2022, and one analyst sees $119.48 if talks stall.
Author  Irene Q.
Sep 14, Mon
Brent crude rose 2.55% to $106.97 and WTI 2.32% to $102.30 as a major regional export pipeline remained offline with no restart timeline. Front-month backwardation has widened to $5.53 from $3.84 a week ago, European gas is at its highest since December 2022, and one analyst sees $119.48 if talks stall.
placeholder
Fed hike odds near 90% into Wednesday's decision — how to trade the dollar, gold and the S&P 500A 0.3% monthly core CPI print has lifted the market-implied probability of a 25bp Fed hike on 16 September to roughly 86.5% ~ 90%, which would be the first increase since July 2023. Here is the decision timeline, the pricing versus the forecasts, both scenarios, and the key levels for the dollar, gold and the S&P 500.
Author  Suzie
Sep 14, Mon
A 0.3% monthly core CPI print has lifted the market-implied probability of a 25bp Fed hike on 16 September to roughly 86.5% ~ 90%, which would be the first increase since July 2023. Here is the decision timeline, the pricing versus the forecasts, both scenarios, and the key levels for the dollar, gold and the S&P 500.
placeholder
Gold falls below $4,300 as higher US yields bolster Fed rate hike betsGold price (XAU/USD) tumbles to near $4,295 during the early Asian session on Tuesday. The precious metal faces some selling pressure as rising bond yields and surging energy prices strengthen expectations that the US Federal Reserve (Fed) will raise interest rates this week. 
Author  FXStreet
23 hours ago
Gold price (XAU/USD) tumbles to near $4,295 during the early Asian session on Tuesday. The precious metal faces some selling pressure as rising bond yields and surging energy prices strengthen expectations that the US Federal Reserve (Fed) will raise interest rates this week. 
placeholder
【Daily Brief】10-year Treasury yield briefly tops 5%, S&P 500 slips to 7,602 and the dollar firms at 99.3 as the Fed's decision eve beginsThe 10-year Treasury yield touched 5.014% on Monday — its first print above 5% since October 2023 — while the S&P 500 closed 0.48% lower at 7,619.98 and the dollar index firmed to 99.3. Here is the full market wrap ahead of Wednesday's FOMC decision, the dot plot and the August retail sales report, plus today's CLARITY Act Senate vote.
Author  Irene Q.
16 hours ago
The 10-year Treasury yield touched 5.014% on Monday — its first print above 5% since October 2023 — while the S&P 500 closed 0.48% lower at 7,619.98 and the dollar index firmed to 99.3. Here is the full market wrap ahead of Wednesday's FOMC decision, the dot plot and the August retail sales report, plus today's CLARITY Act Senate vote.
goTop
quote