

Bitcoin Price Extends Losses, Can Buyers Prevent a Major Breakdown?

Source Newsbtc

Bitcoin price is trimming gains and trading below $120,000. BTC is now showing some bearish signs and might decline below $115,500 zone.

  • Bitcoin started a downside correction below the $120,000 zone.
  • The price is trading below $118,000 and the 100 hourly Simple moving average.
  • There was a break below a key declining channel with support at $116,200 on the hourly chart of the BTC/USD pair (data feed from Kraken).
  • The pair might start another increase if it clears the $118,500 resistance zone.

Bitcoin Price Dips Further

Bitcoin price traded to a new all-time high near $124,000 and started a fresh decline. BTC gained bearish momentum and traded below the $120,000 support zone.

There was a move below the $118,500 support zone and the 100 hourly Simple moving average. Besides, there was a break below a key declining channel with support at $116,200 on the hourly chart of the BTC/USD pair. The pair tested the $115,800 zone.

It is now consolidating losses below the 23.6% Fib retracement level of the recent decline from the $124,420 swing high to the $115,800 low. Bitcoin is now trading below $118,000 and the 100 hourly Simple moving average.

Immediate resistance on the upside is near the $116,850 level. The first key resistance is near the $118,000 level. The next resistance could be $118,500. A close above the $118,500 resistance might send the price further higher.
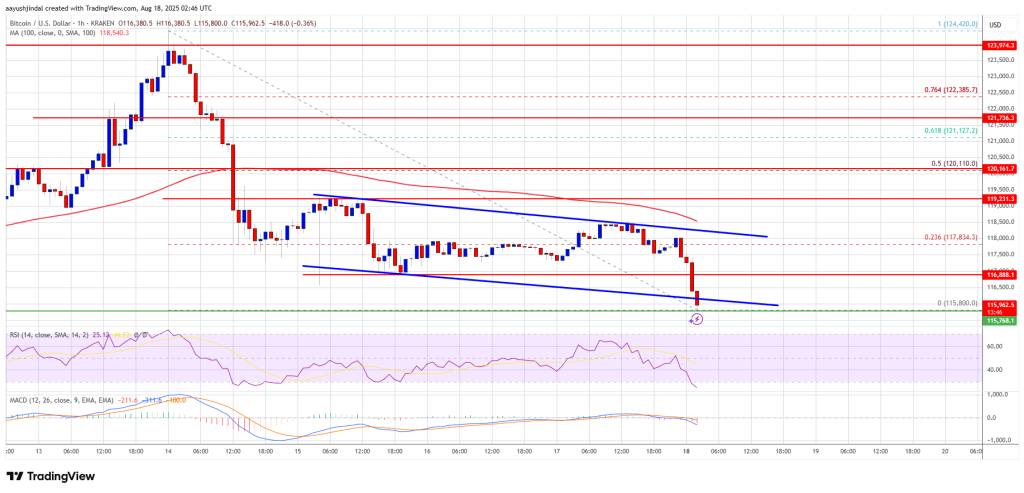
Bitcoin Price

In the stated case, the price could rise and test the $119,200 resistance level. Any more gains might send the price toward the $120,000 level or the 50% Fib retracement level of the recent decline move from the $124,420 swing high to the $115,800 low. The main target could be $121,500.

More Losses In BTC?

If Bitcoin fails to rise above the $118,000 resistance zone, it could start a fresh decline. Immediate support is near the $115,800 level. The first major support is near the $115,000 level.

The next support is now near the $113,500 zone. Any more losses might send the price toward the $112,500 support in the near term. The main support sits at $110,000, below which BTC might continue to move down.

Technical indicators:

Hourly MACD – The MACD is now gaining pace in the bearish zone.

Hourly RSI (Relative Strength Index) – The RSI for BTC/USD is now below the 50 level.

Major Support Levels – $115,800, followed by $115,000.

Major Resistance Levels – $118,000 and $118,500.

Disclaimer: For information purposes only. Past performance is not indicative of future results.
placeholder
US August PPI Preview: Producer Inflation May Reaccelerate, How Will US Stocks, Dollar, and Gold React?The U.S. Bureau of Labor Statistics will release the August Producer Price Index (PPI) at 8:30 a.m. ET on September 10. Against the backdrop of U.S. August non-farm payrolls significantly
Author  TradingKey
11 hours ago
The U.S. Bureau of Labor Statistics will release the August Producer Price Index (PPI) at 8:30 a.m. ET on September 10. Against the backdrop of U.S. August non-farm payrolls significantly
placeholder
Brent Crude Surpasses $100 Mark as Escalating Middle East Conflict Sparks Market ConcernsOn September 9, Brent crude futures broke above $100 per barrel intraday, crossing this threshold for the first time since July 24. As the military conflict between the US and Iran contin
Author  TradingKey
12 hours ago
On September 9, Brent crude futures broke above $100 per barrel intraday, crossing this threshold for the first time since July 24. As the military conflict between the US and Iran contin
placeholder
US dollar clings to nine-week lows near 98.4 as Brent nears $100 and the yen hits a seven-month high — five events to watch todayThe dollar is pinned near nine-week lows even after a blockbuster jobs report, as an oil spike toward $100, a surging yen and China's reflation data crowd the driver's seat. Five key events to watch today: Brent at $99.46, USD/JPY at 154, China CPI/PPI, PBOC gold buying, and Thursday's PPI / Friday's CPI ahead of the September 15-16 FOMC.
Author  Eric Nkando
14 hours ago
The dollar is pinned near nine-week lows even after a blockbuster jobs report, as an oil spike toward $100, a surging yen and China's reflation data crowd the driver's seat. Five key events to watch today: Brent at $99.46, USD/JPY at 154, China CPI/PPI, PBOC gold buying, and Thursday's PPI / Friday's CPI ahead of the September 15-16 FOMC.
placeholder
Today’s Market Recap: Oil Nears $100, US Stocks Fall, AI Chip Stocks Buck Trend as Intel Surges Over 9%Tracking Market TrendsTradingKey - On September 8 Eastern Time, the three major U.S. stock indices closed lower across the board, with the Dow falling by more than 1%. Further escalation in the Middle
Author  TradingKey
20 hours ago
Tracking Market TrendsTradingKey - On September 8 Eastern Time, the three major U.S. stock indices closed lower across the board, with the Dow falling by more than 1%. Further escalation in the Middle
placeholder
Gold slumps to near $4,350 amid oil-driven inflation fears, US inflation data in focusGold price (XAU/USD) falls to near $4,350 during the early Asian session on Wednesday. The precious metal faces some selling pressure as rising oil prices fueled inflation ‌concerns and boosted expectations for a rate hike by the Federal Reserve (Fed) in September.
Author  FXStreet
20 hours ago
Gold price (XAU/USD) falls to near $4,350 during the early Asian session on Wednesday. The precious metal faces some selling pressure as rising oil prices fueled inflation ‌concerns and boosted expectations for a rate hike by the Federal Reserve (Fed) in September.
goTop
quote