

Ethereum Price Breaks Toward $5,000, Analyst Reveals When To Sell Everything And Why

Source Newsbtc

Ethereum has surged more than 20% to firmly reclaim the $4,200 price level for the first time since 2021. This interesting move has come off the back of Ethereum’s steady inch higher, and $5,000 could now be the next major psychological barrier. However, while the bullish narrative is currently dominant, a technical analysis posted by crypto trader Orbion suggests that this rally may have an expiration date.

The Road To Euphoria And A Full Exit Plan

Ethereum’s price action over the past week has seen it outperform many cryptocurrencies, and confidence is steadily returning to the leading altcoin. However, Orbion took to the social media platform X to share that he had already sold 33% of his Ethereum holdings, and the best time to fully exit every Ethereum position is in the next two months. 

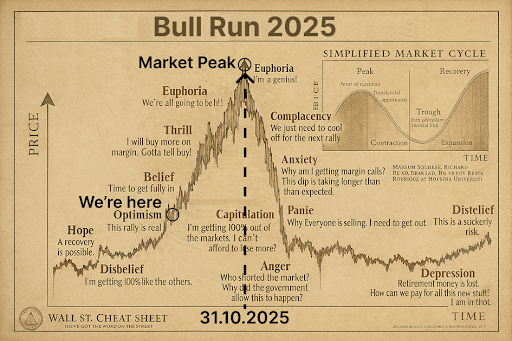
His post was accompanied by a well-known cheat sheet on market cycles. According to the sheet, Ethereum’s current position is in the Optimism and Ethereum dominance phase. The Optimism phase is the point in a rally when market participants begin to believe that the uptrend is truly sustainable. 
Ethereum

Notably, the chart’s projection is a climb to the Market Peak/Euphoria phase by the end of October 2025. It is at this point that traders can expect an extreme overvaluation and a looming downturn. Drawing similarities to similar patterns in 2017 and 2021, Orbion stated that his plan is to sell the remainder of his ETH holdings by October 31, although the price will start tapering off in late September.

Projecting Ethereum’s Next Move

According to the projection on the chart above, Ethereum still has a long way to go before it reaches a defined peak. That is to say, there’s a high possibility that Ethereum could finally break above its 2021 all-time high of $4,878.

It will be interesting to see how the Ethereum price rally plays out in the next two months before it reaches a new peak. Based on the cheat sheet, Ethereum could see its most aggressive price acceleration in the weeks leading up to Halloween on October 31. This final leg of the rally will be driven by euphoria-fueled buying, where investors feel unstoppable and certain of a continued rally, much like the 2021 cycle.

Even if Ethereum were to start crashing by late October, its current trajectory suggests it could break $5,000 before it reaches a new peak. Notably, Orbion’s short-term target for ETH is in the $5,800 to $6,000 range if momentum continues. 

Technical analyses show Ethereum price targets ranging from $4,800 to as high as $12,000. According to a technical analysis from crypto analyst Titan of Crypto, Ethereum is currently tracing out the same pattern as Bitcoin in 2020 and is on a path to reach $12,000.

At the time of writing, Ethereum is trading at $4,270, up by 20.5% in the past seven days.

Ethereum
Disclaimer: For information purposes only. Past performance is not indicative of future results.
placeholder
US August CPI lands tonight: after a 5.4% PPI shock, will the Fed hike on September 16?US August PPI came in at 5.4% year-on-year, above the 5.3% consensus, with core PPI at 4.6%. Traders have pushed the odds of a 25bp Fed hike on September 15-16 to around 70%. Tonight's CPI is the last major inflation print before the decision — here is the full calendar, the consensus numbers, and what a hot versus cool reading would mean for the dollar, yields, gold and stocks.
Author  Irene Q.
Sep 11, Fri
US August PPI came in at 5.4% year-on-year, above the 5.3% consensus, with core PPI at 4.6%. Traders have pushed the odds of a 25bp Fed hike on September 15-16 to around 70%. Tonight's CPI is the last major inflation print before the decision — here is the full calendar, the consensus numbers, and what a hot versus cool reading would mean for the dollar, yields, gold and stocks.
placeholder
Brent tests $108 as a key export pipeline stays shut — can the rally clear $110?Brent crude rose 2.55% to $106.97 and WTI 2.32% to $102.30 as a major regional export pipeline remained offline with no restart timeline. Front-month backwardation has widened to $5.53 from $3.84 a week ago, European gas is at its highest since December 2022, and one analyst sees $119.48 if talks stall.
Author  Irene Q.
Sep 14, Mon
Brent crude rose 2.55% to $106.97 and WTI 2.32% to $102.30 as a major regional export pipeline remained offline with no restart timeline. Front-month backwardation has widened to $5.53 from $3.84 a week ago, European gas is at its highest since December 2022, and one analyst sees $119.48 if talks stall.
placeholder
Fed hike odds near 90% into Wednesday's decision — how to trade the dollar, gold and the S&P 500A 0.3% monthly core CPI print has lifted the market-implied probability of a 25bp Fed hike on 16 September to roughly 86.5% ~ 90%, which would be the first increase since July 2023. Here is the decision timeline, the pricing versus the forecasts, both scenarios, and the key levels for the dollar, gold and the S&P 500.
Author  Suzie
Sep 14, Mon
A 0.3% monthly core CPI print has lifted the market-implied probability of a 25bp Fed hike on 16 September to roughly 86.5% ~ 90%, which would be the first increase since July 2023. Here is the decision timeline, the pricing versus the forecasts, both scenarios, and the key levels for the dollar, gold and the S&P 500.
placeholder
Gold falls below $4,300 as higher US yields bolster Fed rate hike betsGold price (XAU/USD) tumbles to near $4,295 during the early Asian session on Tuesday. The precious metal faces some selling pressure as rising bond yields and surging energy prices strengthen expectations that the US Federal Reserve (Fed) will raise interest rates this week. 
Author  FXStreet
23 hours ago
Gold price (XAU/USD) tumbles to near $4,295 during the early Asian session on Tuesday. The precious metal faces some selling pressure as rising bond yields and surging energy prices strengthen expectations that the US Federal Reserve (Fed) will raise interest rates this week. 
placeholder
【Daily Brief】10-year Treasury yield briefly tops 5%, S&P 500 slips to 7,602 and the dollar firms at 99.3 as the Fed's decision eve beginsThe 10-year Treasury yield touched 5.014% on Monday — its first print above 5% since October 2023 — while the S&P 500 closed 0.48% lower at 7,619.98 and the dollar index firmed to 99.3. Here is the full market wrap ahead of Wednesday's FOMC decision, the dot plot and the August retail sales report, plus today's CLARITY Act Senate vote.
Author  Irene Q.
16 hours ago
The 10-year Treasury yield touched 5.014% on Monday — its first print above 5% since October 2023 — while the S&P 500 closed 0.48% lower at 7,619.98 and the dollar index firmed to 99.3. Here is the full market wrap ahead of Wednesday's FOMC decision, the dot plot and the August retail sales report, plus today's CLARITY Act Senate vote.
goTop
quote