Cardano holders realize nearly $20 million in losses as ADA price bleeds

Source Fxstreet
  • Cardano holders realized $20.09 million in losses on Tuesday, on-chain data shows. 
  • ADA price fell to $0.58 for the first time since mid-February. 
  • Over 60% of Cardano holders are sitting on unrealized gains, profit-taking could push ADA price further down.

Cardano (ADA) price dipped to $0.56 on Wednesday, offering sidelined buyers the opportunity to buy the token nearly 30% below its year-to-date peak of $0.8104. The decline followed a marketwide correction and mass liquidations in Bitcoin after its price dropped to $62,000. 

Cardano’s holders realized large volumes of losses on Tuesday, on-chain data shows. If holders continue to shed their ADA holdings, the Ethereum-alternative token could crumble under selling pressure. 

Also read: Cardano price ranges below $0.63, ADA on-chain metrics show signs of sell-off

Cardano holders sell ADA at losses 

Cardano price dropped to $0.56 on Wednesday, the lowest level  since mid-February. The altcoin’s decline saw traders shedding their ADA holdings and de-risking for fear of a steeper correction. Santiment data shows that traders realized $20.09 million in losses on Tuesday and nearly $785,000 on Wednesday at the time of writing. 

The Network Realized Profit/ Loss metric sees shows pronounced dips, a sign that alongside the recent price drop, suggests that this could be a capitulation event.

Cardano

Cardano Network Realized Profit/Loss. Source: Santiment 

Meanwhile, around 64% of the wallet addresses holding Cardano are currently sitting on unrealized gains, as per IntoTheBlock data. If ADA holders start taking profits, it could increase the selling pressure on Cardano and result in a sharper fall in ADA price. 

The $0.59 to $0.64 range is crucial to Cardano’s recovery as it represents the range in which 178,410 wallet addresses bought 2.23 billion ADA tokens. If ADA price closes below the $0.59 level on the daily time frame, another 178,410 wallet addresses will be underwater (meaning that investors will be sitting on unrealized losses).
 

Cardano

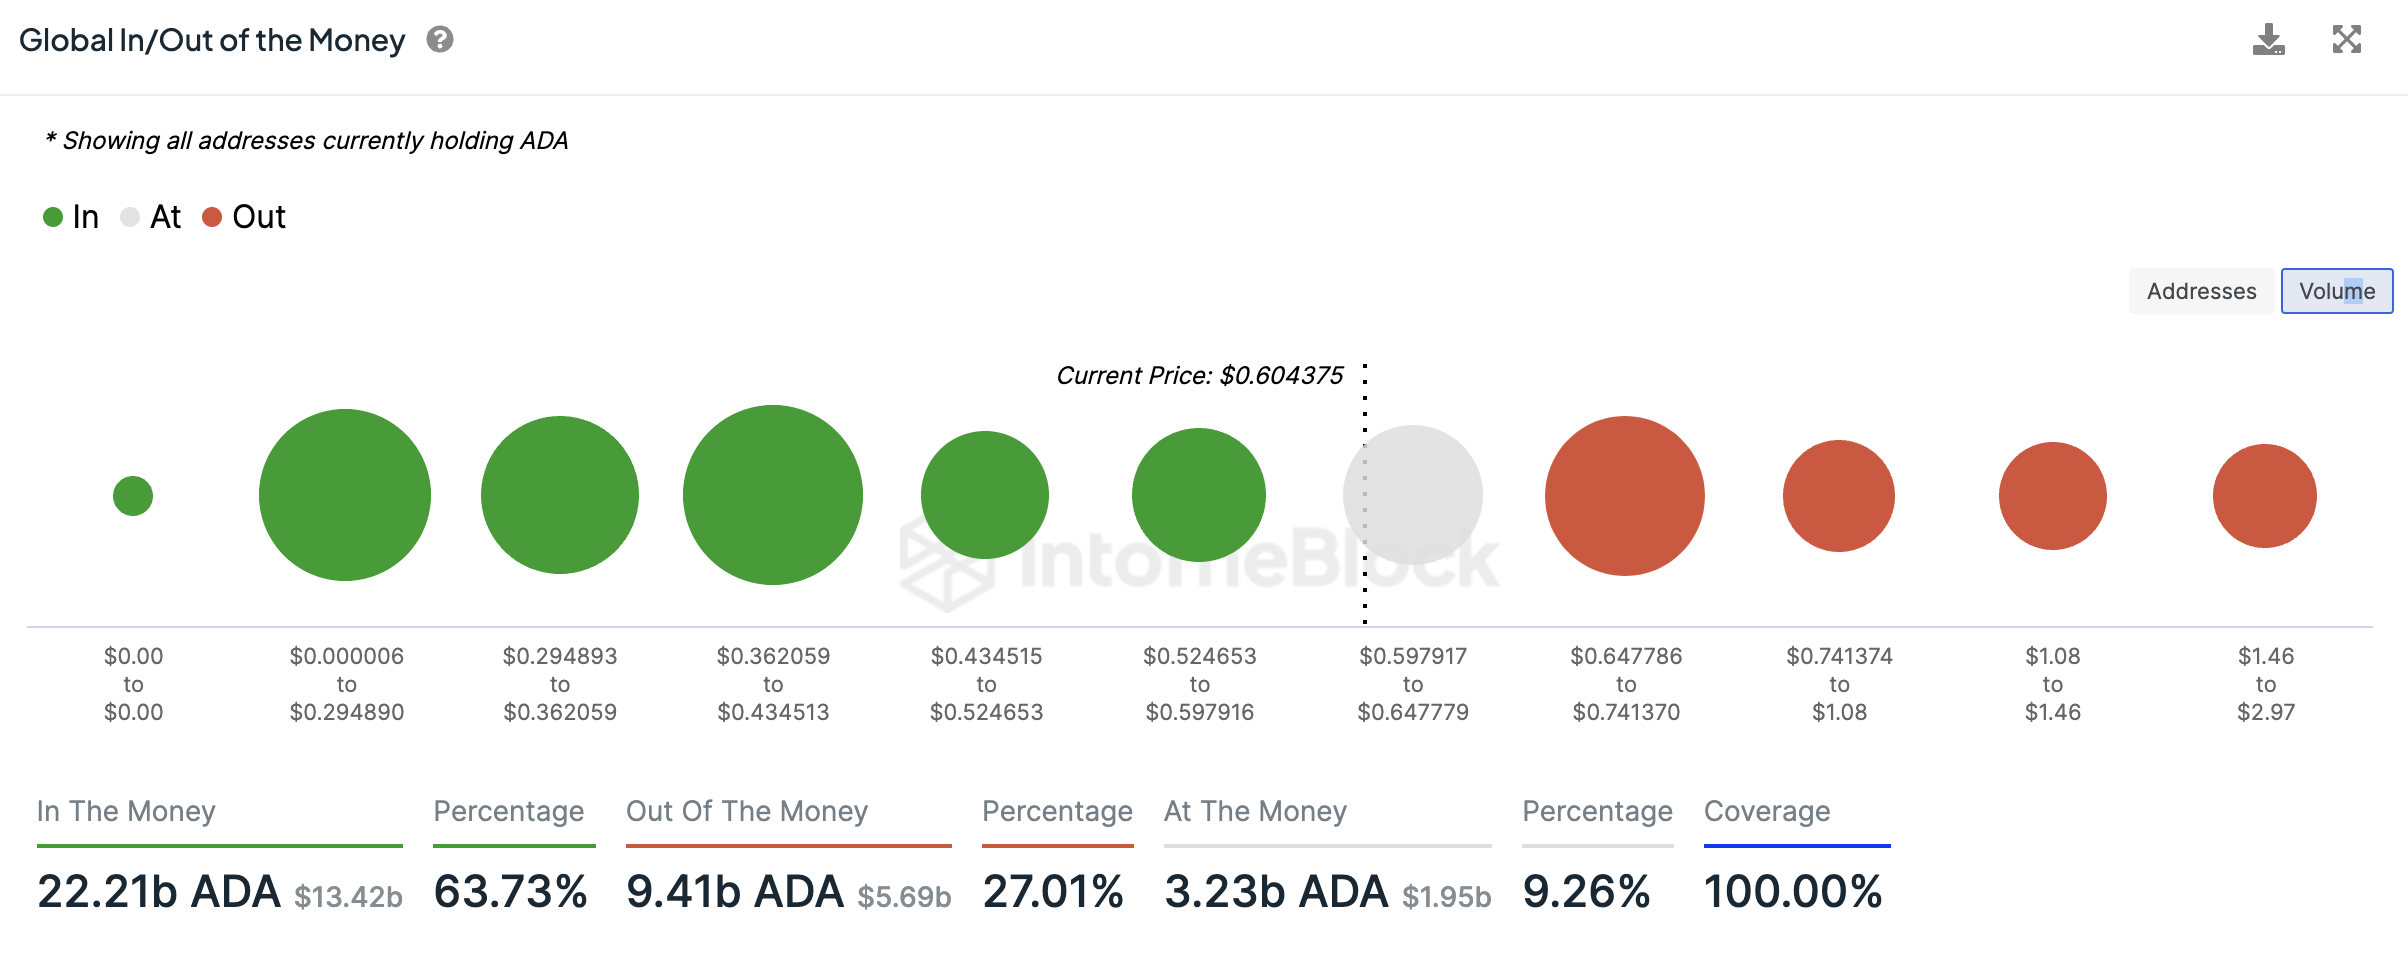
Global In/Out of the Money. Source: IntoTheBlock 

Cardano price could enter distribution phase, bleed further

Cardano price is likely to consolidate further before recovering. The Ethereum alternative has been declining since it hit its year-to-date peak of $0.8104 on March 14. ADA price has corrected nearly 30% since then, down to Wednesday’s intraday low of $0.5689. 

ADA price could collect liquidity below $0.5333, the 23.6% Fibonacci retracement of the altcoin’s rally to the March 14 local top. 

The Moving Average Convergence/Divergence indicator shows there is negative momentum. The Relative Strength Index (RSI) is at 41.25, below the neutral zone, suggesting that bearish momentum could be gaining traction. ADA could generate a buy signal once the RSI dips to 30, the oversold region. 

ADA

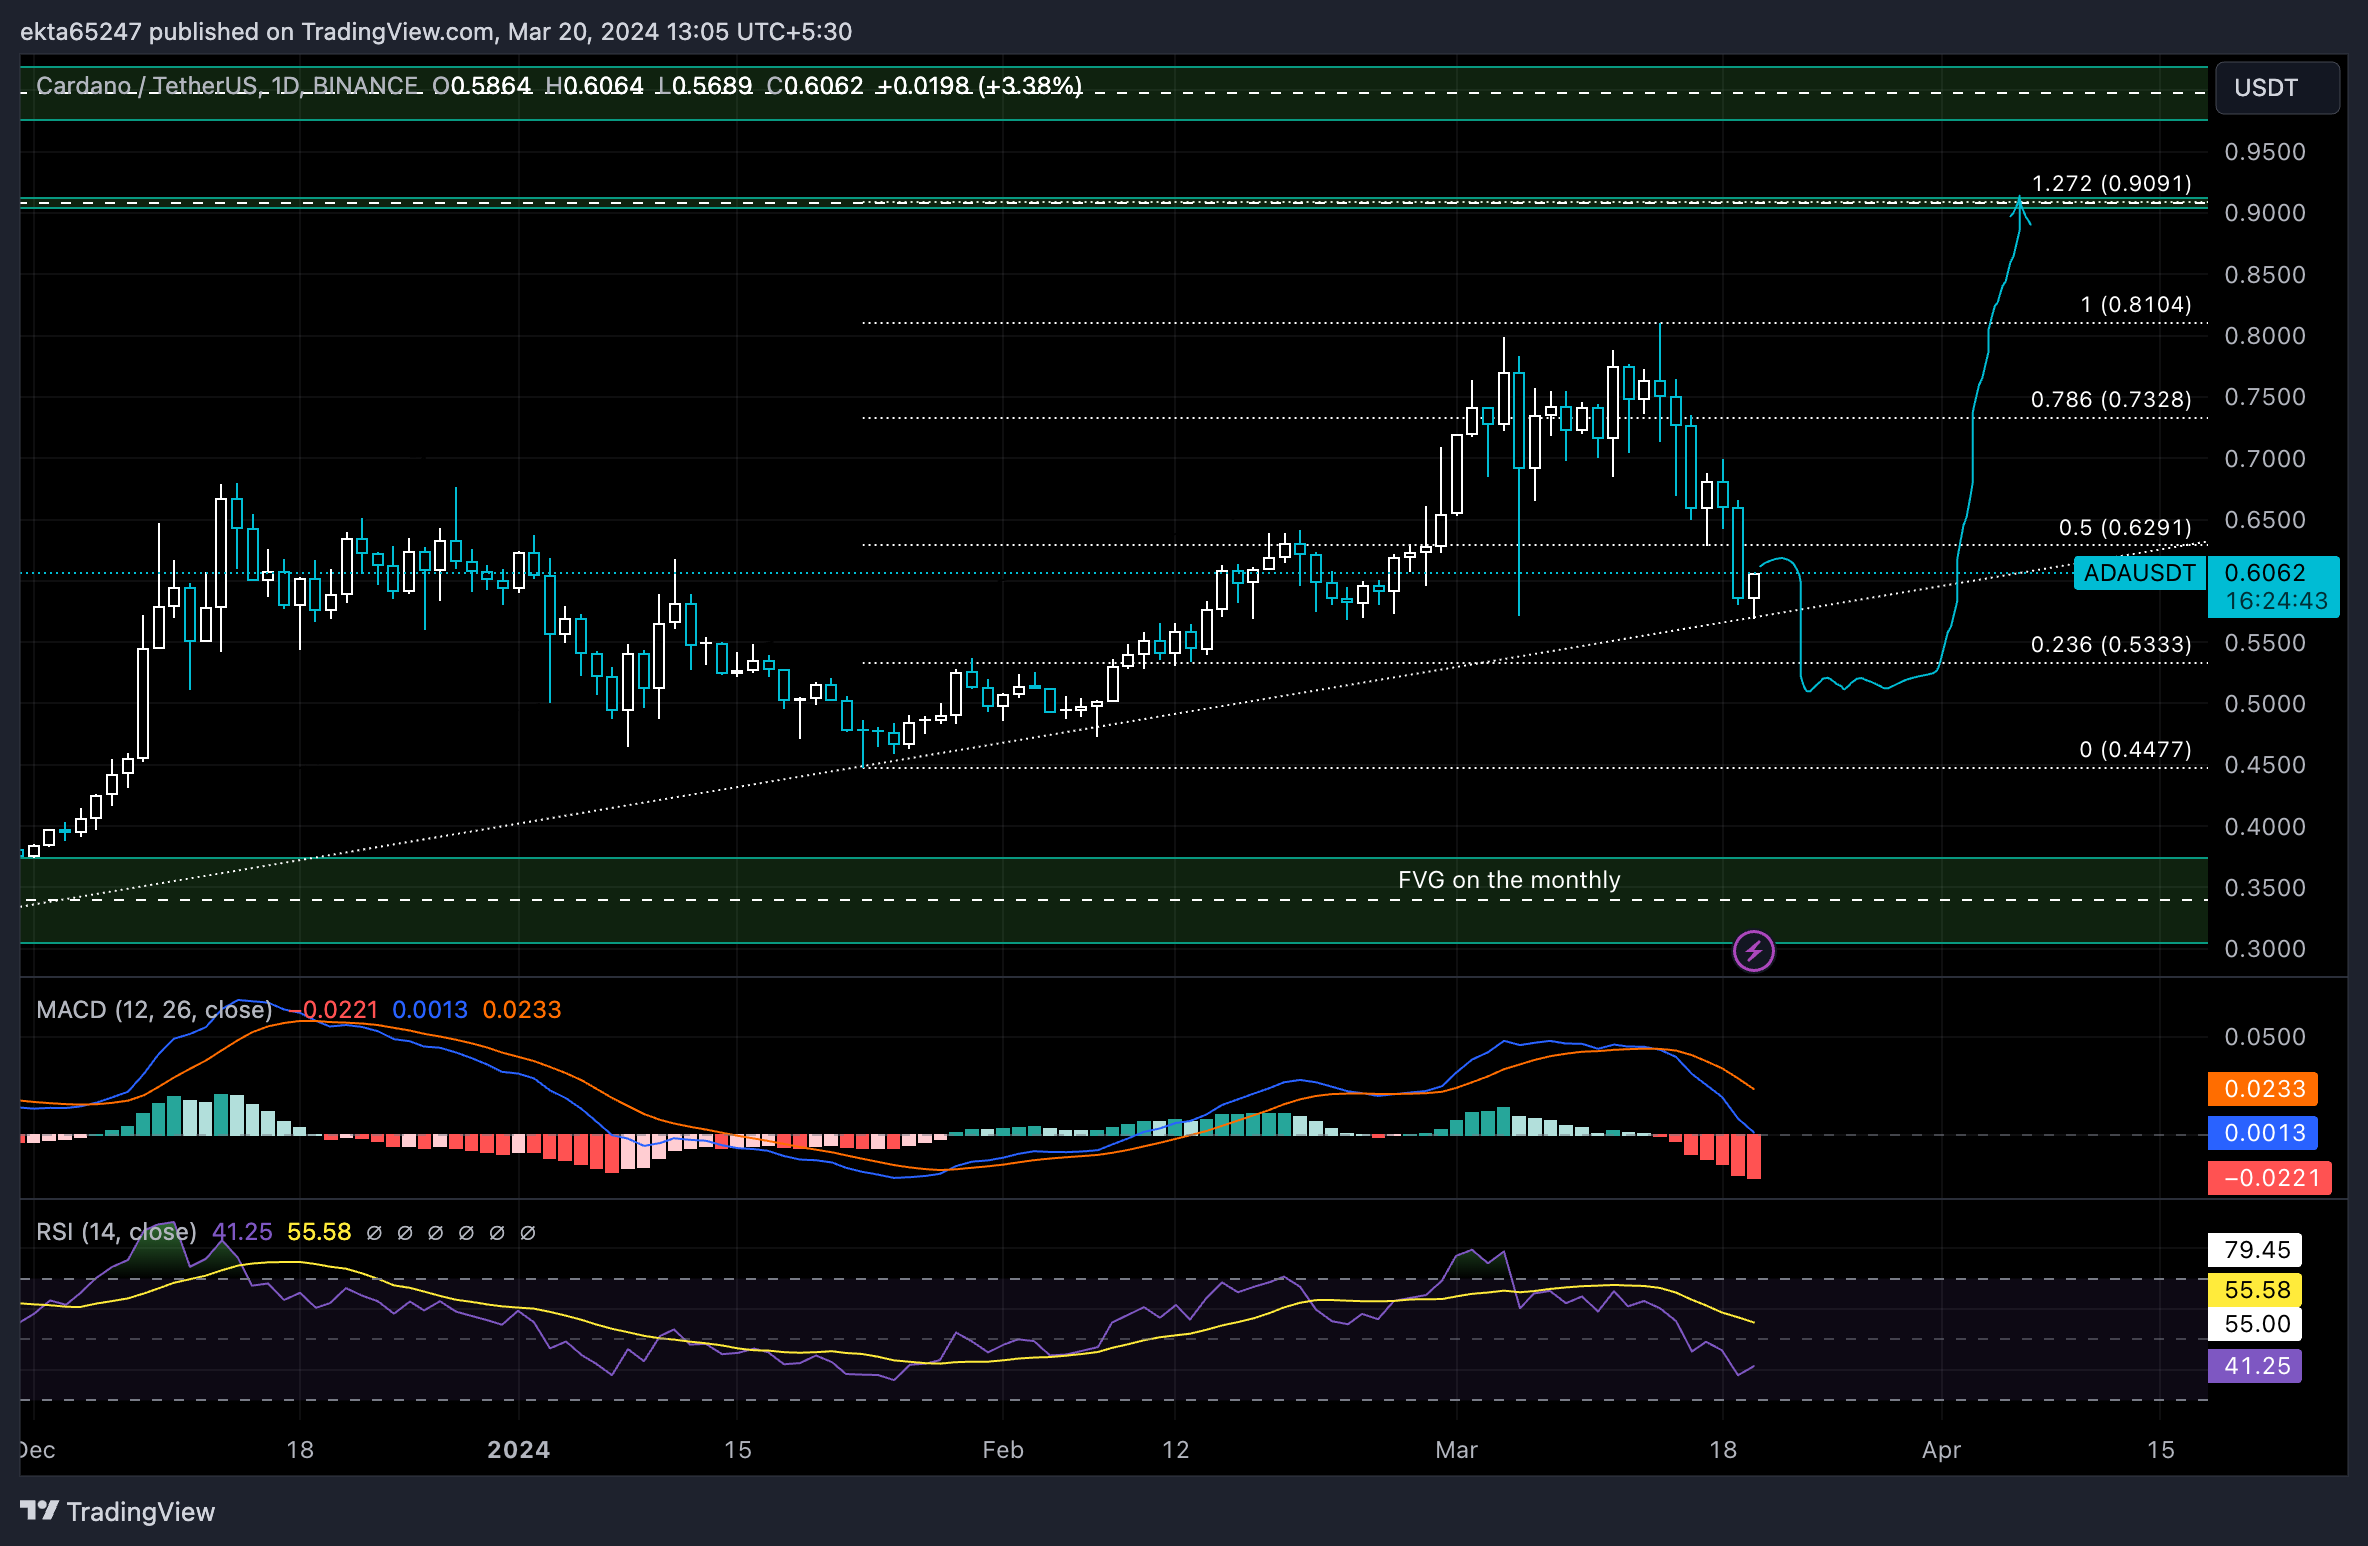
ADA/USDT 1-day chart 

In an upside scenario, Cardano price could see an impulsive climb past resistance at $0.6291, the 50% Fibonacci retracement level. If ADA price flips this level into support and sees a daily candlestick close above the 50% Fib. level, it would invalidate the bearish thesis and signal a rebound. 

ADA price could march towards the $0.7328 and $0.8104 resistances in its path to the $0.90 target, representing the 127.2% Fibonacci extension level. 

Disclaimer: For information purposes only. Past performance is not indicative of future results.
placeholder
U.S. November Nonfarm Payrolls: What Does the Rare "Weak Jobs, Strong Economy" Mix Mean for U.S. Equities?1. IntroductionAfter retreating from the late-October highs, U.S. equities embarked on a bottoming rebound in mid-to-late November, a trend driven by the interplay of multiple factors. That said, it i
Author  TradingKey
10 hours ago
1. IntroductionAfter retreating from the late-October highs, U.S. equities embarked on a bottoming rebound in mid-to-late November, a trend driven by the interplay of multiple factors. That said, it i
placeholder
Senate Delays Crypto Market Structure Hearings to Early 2026The Senate Banking Committee has postponed cryptocurrency market structure hearings until 2026, citing ongoing bipartisan negotiations.
Author  Mitrade
14 hours ago
The Senate Banking Committee has postponed cryptocurrency market structure hearings until 2026, citing ongoing bipartisan negotiations.
placeholder
Bitcoin Slides 5% as Sellers Lean In — Can BTC Reclaim $88,000?Bitcoin has dropped back below $88,000 after rolling over from $90,500, with price still trading under the 100-hour Simple Moving Average. The sell-off found a floor at $85,151, and BTC is now consolidating near that base, but rebounds are facing pressure from a bearish trend line around $89,000. Bulls need to retake $88,000–$89,000 to ease downside risk; failure to do so keeps $85,500–$85,000 and then $83,500 in play, with $80,000 as the deeper “line in the sand.” Bitcoin (BTC) is back in damage-control mode after a sharp pullback wiped out recent gains. The price failed to reclaim the $90,000–$90,500 band, rolled over, and slid through $88,500 before briefly dipping under $87,000. Buyers did show up around $85,000, but the rebound so far looks more like stabilization than a clear trend reversal. Bitcoin dips hard, finds a bid near $85,000(h3) BTC’s latest move lower began when it couldn’t build follow-through above $90,000 and $90,500. Once that upside stalled, sellers took control and pushed price down through $88,500. The slide accelerated enough to spike below $87,000, but the market didn’t free-fall. Bulls defended the $85,000 zone, printing a low at $85,151. Since then, Bitcoin has been consolidating below the 23.6% Fibonacci retracement of the drop from the $93,560 swing high to the $85,151 low — a clue that the bounce is still shallow and that sellers haven’t fully backed off yet. Structurally, BTC is still on the back foot: It’s trading below $88,000, and It remains below the 100-hour Simple Moving Average, keeping short-term trend pressure pointed downward. Resistance is layered, and $89,000 is the problem area(h3) If bulls try to turn this into a recovery, they’ll have to climb through multiple ceilings in quick succession. First, BTC faces resistance around $87,150, followed by a more meaningful barrier near $87,500. From there, the market’s attention snaps back to $88,000 — the level BTC just lost and now needs to reclaim. A close back above $88,000 would improve the tone, but it doesn’t solve the bigger issue: there’s a bearish trend line on the hourly BTC/USD chart (Kraken feed) with resistance near $89,000, which also lines up with the next technical hurdle. If BTC can push through $89,000 and hold, the rebound could extend toward $90,000, with follow-through targets at $91,000 and $91,500. But until price clears that $88,000–$89,000 zone, rallies are at risk of being sold rather than chased. If BTC fails to reclaim resistance, the downside path is clear(h3) The near-term bear case is simple: if Bitcoin can’t climb back above the $87,000 area and keep traction, sellers may attempt another leg lower. Support levels line up like this: Immediate support: $85,500 First major support: $85,000 Next support: $83,500 Then $82,500 in the near term Below that, the major “don’t break this” level is still $80,000. If BTC slips under $80,000, the risk of acceleration to the downside increases significantly — not because it’s magic, but because it’s the kind of psychological and structural level that tends to trigger forced de-risking. Indicators: momentum still leans bearish(h3) The intraday indicators aren’t offering much comfort yet: Hourly MACD is losing pace in the bearish zone. Hourly RSI remains below 50, suggesting sellers still have the upper hand on short timeframes. So while the $85,000 defense held for now, the market hasn’t flipped bullish — it’s just stopped bleeding.
Author  Mitrade
17 hours ago
Bitcoin has dropped back below $88,000 after rolling over from $90,500, with price still trading under the 100-hour Simple Moving Average. The sell-off found a floor at $85,151, and BTC is now consolidating near that base, but rebounds are facing pressure from a bearish trend line around $89,000. Bulls need to retake $88,000–$89,000 to ease downside risk; failure to do so keeps $85,500–$85,000 and then $83,500 in play, with $80,000 as the deeper “line in the sand.” Bitcoin (BTC) is back in damage-control mode after a sharp pullback wiped out recent gains. The price failed to reclaim the $90,000–$90,500 band, rolled over, and slid through $88,500 before briefly dipping under $87,000. Buyers did show up around $85,000, but the rebound so far looks more like stabilization than a clear trend reversal. Bitcoin dips hard, finds a bid near $85,000(h3) BTC’s latest move lower began when it couldn’t build follow-through above $90,000 and $90,500. Once that upside stalled, sellers took control and pushed price down through $88,500. The slide accelerated enough to spike below $87,000, but the market didn’t free-fall. Bulls defended the $85,000 zone, printing a low at $85,151. Since then, Bitcoin has been consolidating below the 23.6% Fibonacci retracement of the drop from the $93,560 swing high to the $85,151 low — a clue that the bounce is still shallow and that sellers haven’t fully backed off yet. Structurally, BTC is still on the back foot: It’s trading below $88,000, and It remains below the 100-hour Simple Moving Average, keeping short-term trend pressure pointed downward. Resistance is layered, and $89,000 is the problem area(h3) If bulls try to turn this into a recovery, they’ll have to climb through multiple ceilings in quick succession. First, BTC faces resistance around $87,150, followed by a more meaningful barrier near $87,500. From there, the market’s attention snaps back to $88,000 — the level BTC just lost and now needs to reclaim. A close back above $88,000 would improve the tone, but it doesn’t solve the bigger issue: there’s a bearish trend line on the hourly BTC/USD chart (Kraken feed) with resistance near $89,000, which also lines up with the next technical hurdle. If BTC can push through $89,000 and hold, the rebound could extend toward $90,000, with follow-through targets at $91,000 and $91,500. But until price clears that $88,000–$89,000 zone, rallies are at risk of being sold rather than chased. If BTC fails to reclaim resistance, the downside path is clear(h3) The near-term bear case is simple: if Bitcoin can’t climb back above the $87,000 area and keep traction, sellers may attempt another leg lower. Support levels line up like this: Immediate support: $85,500 First major support: $85,000 Next support: $83,500 Then $82,500 in the near term Below that, the major “don’t break this” level is still $80,000. If BTC slips under $80,000, the risk of acceleration to the downside increases significantly — not because it’s magic, but because it’s the kind of psychological and structural level that tends to trigger forced de-risking. Indicators: momentum still leans bearish(h3) The intraday indicators aren’t offering much comfort yet: Hourly MACD is losing pace in the bearish zone. Hourly RSI remains below 50, suggesting sellers still have the upper hand on short timeframes. So while the $85,000 defense held for now, the market hasn’t flipped bullish — it’s just stopped bleeding.
placeholder
AUD/USD remains depressed below mid-0.6600s; downside seems limited ahead of US NFP reportThe AUD/USD pair attracts some sellers for the fourth straight day on Tuesday and trades around the 0.6630 region, down just over 0.10%, during the Asian session.
Author  FXStreet
18 hours ago
The AUD/USD pair attracts some sellers for the fourth straight day on Tuesday and trades around the 0.6630 region, down just over 0.10%, during the Asian session.
placeholder
Macro Analysts: Hawkish Japan Could Push Bitcoin Below $70KAnalysts predict Bitcoin may face further declines towards the $70,000 mark if the Bank of Japan raises interest rates as expected.
Author  Mitrade
Yesterday 05: 48
Analysts predict Bitcoin may face further declines towards the $70,000 mark if the Bank of Japan raises interest rates as expected.
goTop
quote