
Top Crypto Gainers: Pump.fun, Ethena, Sonic emerge as frontrunners
- Pump.fun rises by 15% so far on Thursday, extending the channel breakout rally.
- Ethena edges higher by 4% after bouncing off a crucial support on Wednesday.
- Sonic holds above $0.30 with a short-term recovery within a falling wedge pattern.
Altcoins gain traction, following the recovery in Ethereum (ETH) and a capital shift from Bitcoin (BTC) to other cryptocurrency avenues. Pump.fun (PUMP), Ethena (ENA), and Sonic (S) led the broader market gains over the last 24 hours, hinting at an extended uptrend.
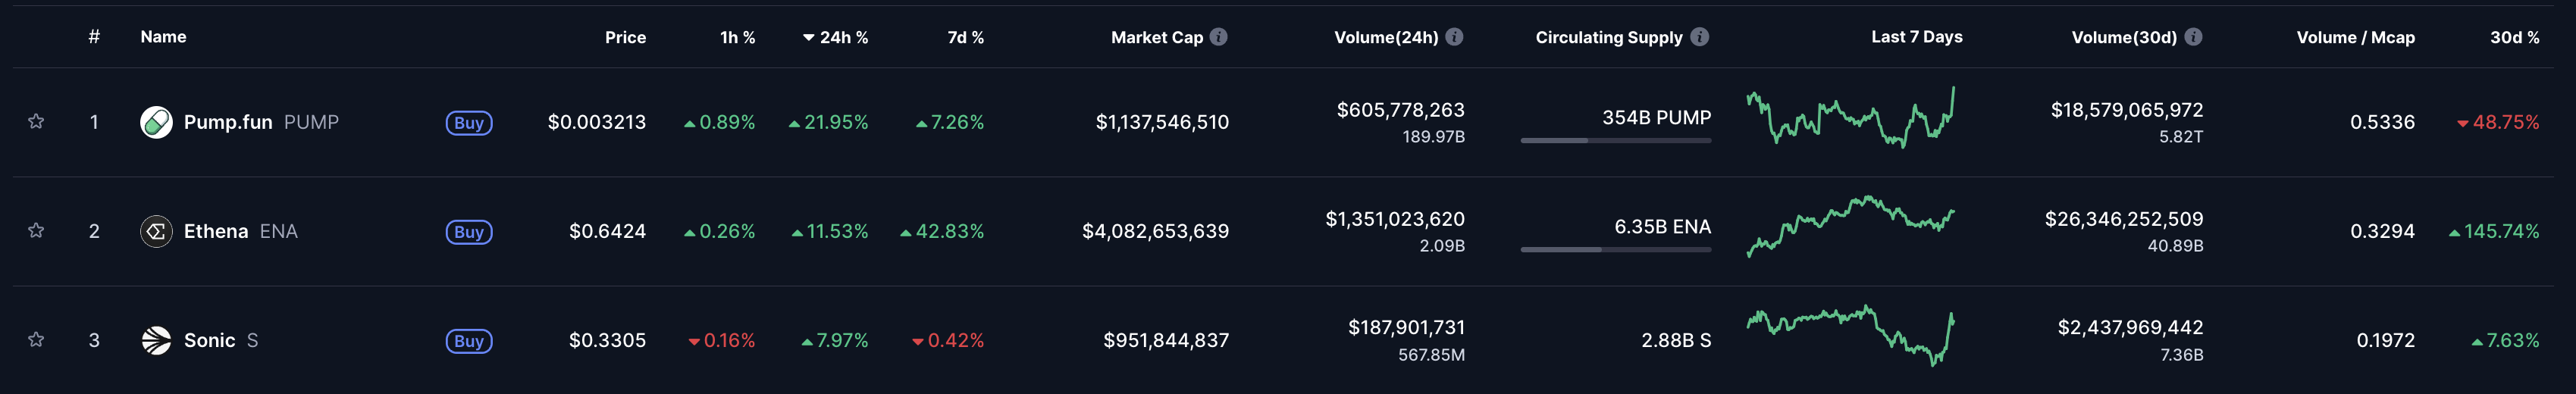
Top Crypto Gainers: Source: CoinMarketCap.
Pump.fun extends the channel breakout rally
PUMP edges higher by 15% at press time on Thursday, extending the breakout rally of a falling channel on the 4-hour price chart. The recovery run also exceeds the $0.0030 level, which formed a consolidation range with a base support at $0.0023.
PUMP targets the $0.0037 level marked by the low of July 18, for a near 20% upside potential.
Investors could increase their exposure as the Moving Average Convergence Divergence (MACD) displays a rising trend, with green histogram bars indicating increased bullish momentum.
The Relative Strength Index (RSI) reads 62 on the 4-hour chart, holding a steady trend to the overbought boundary as buying pressure increases.
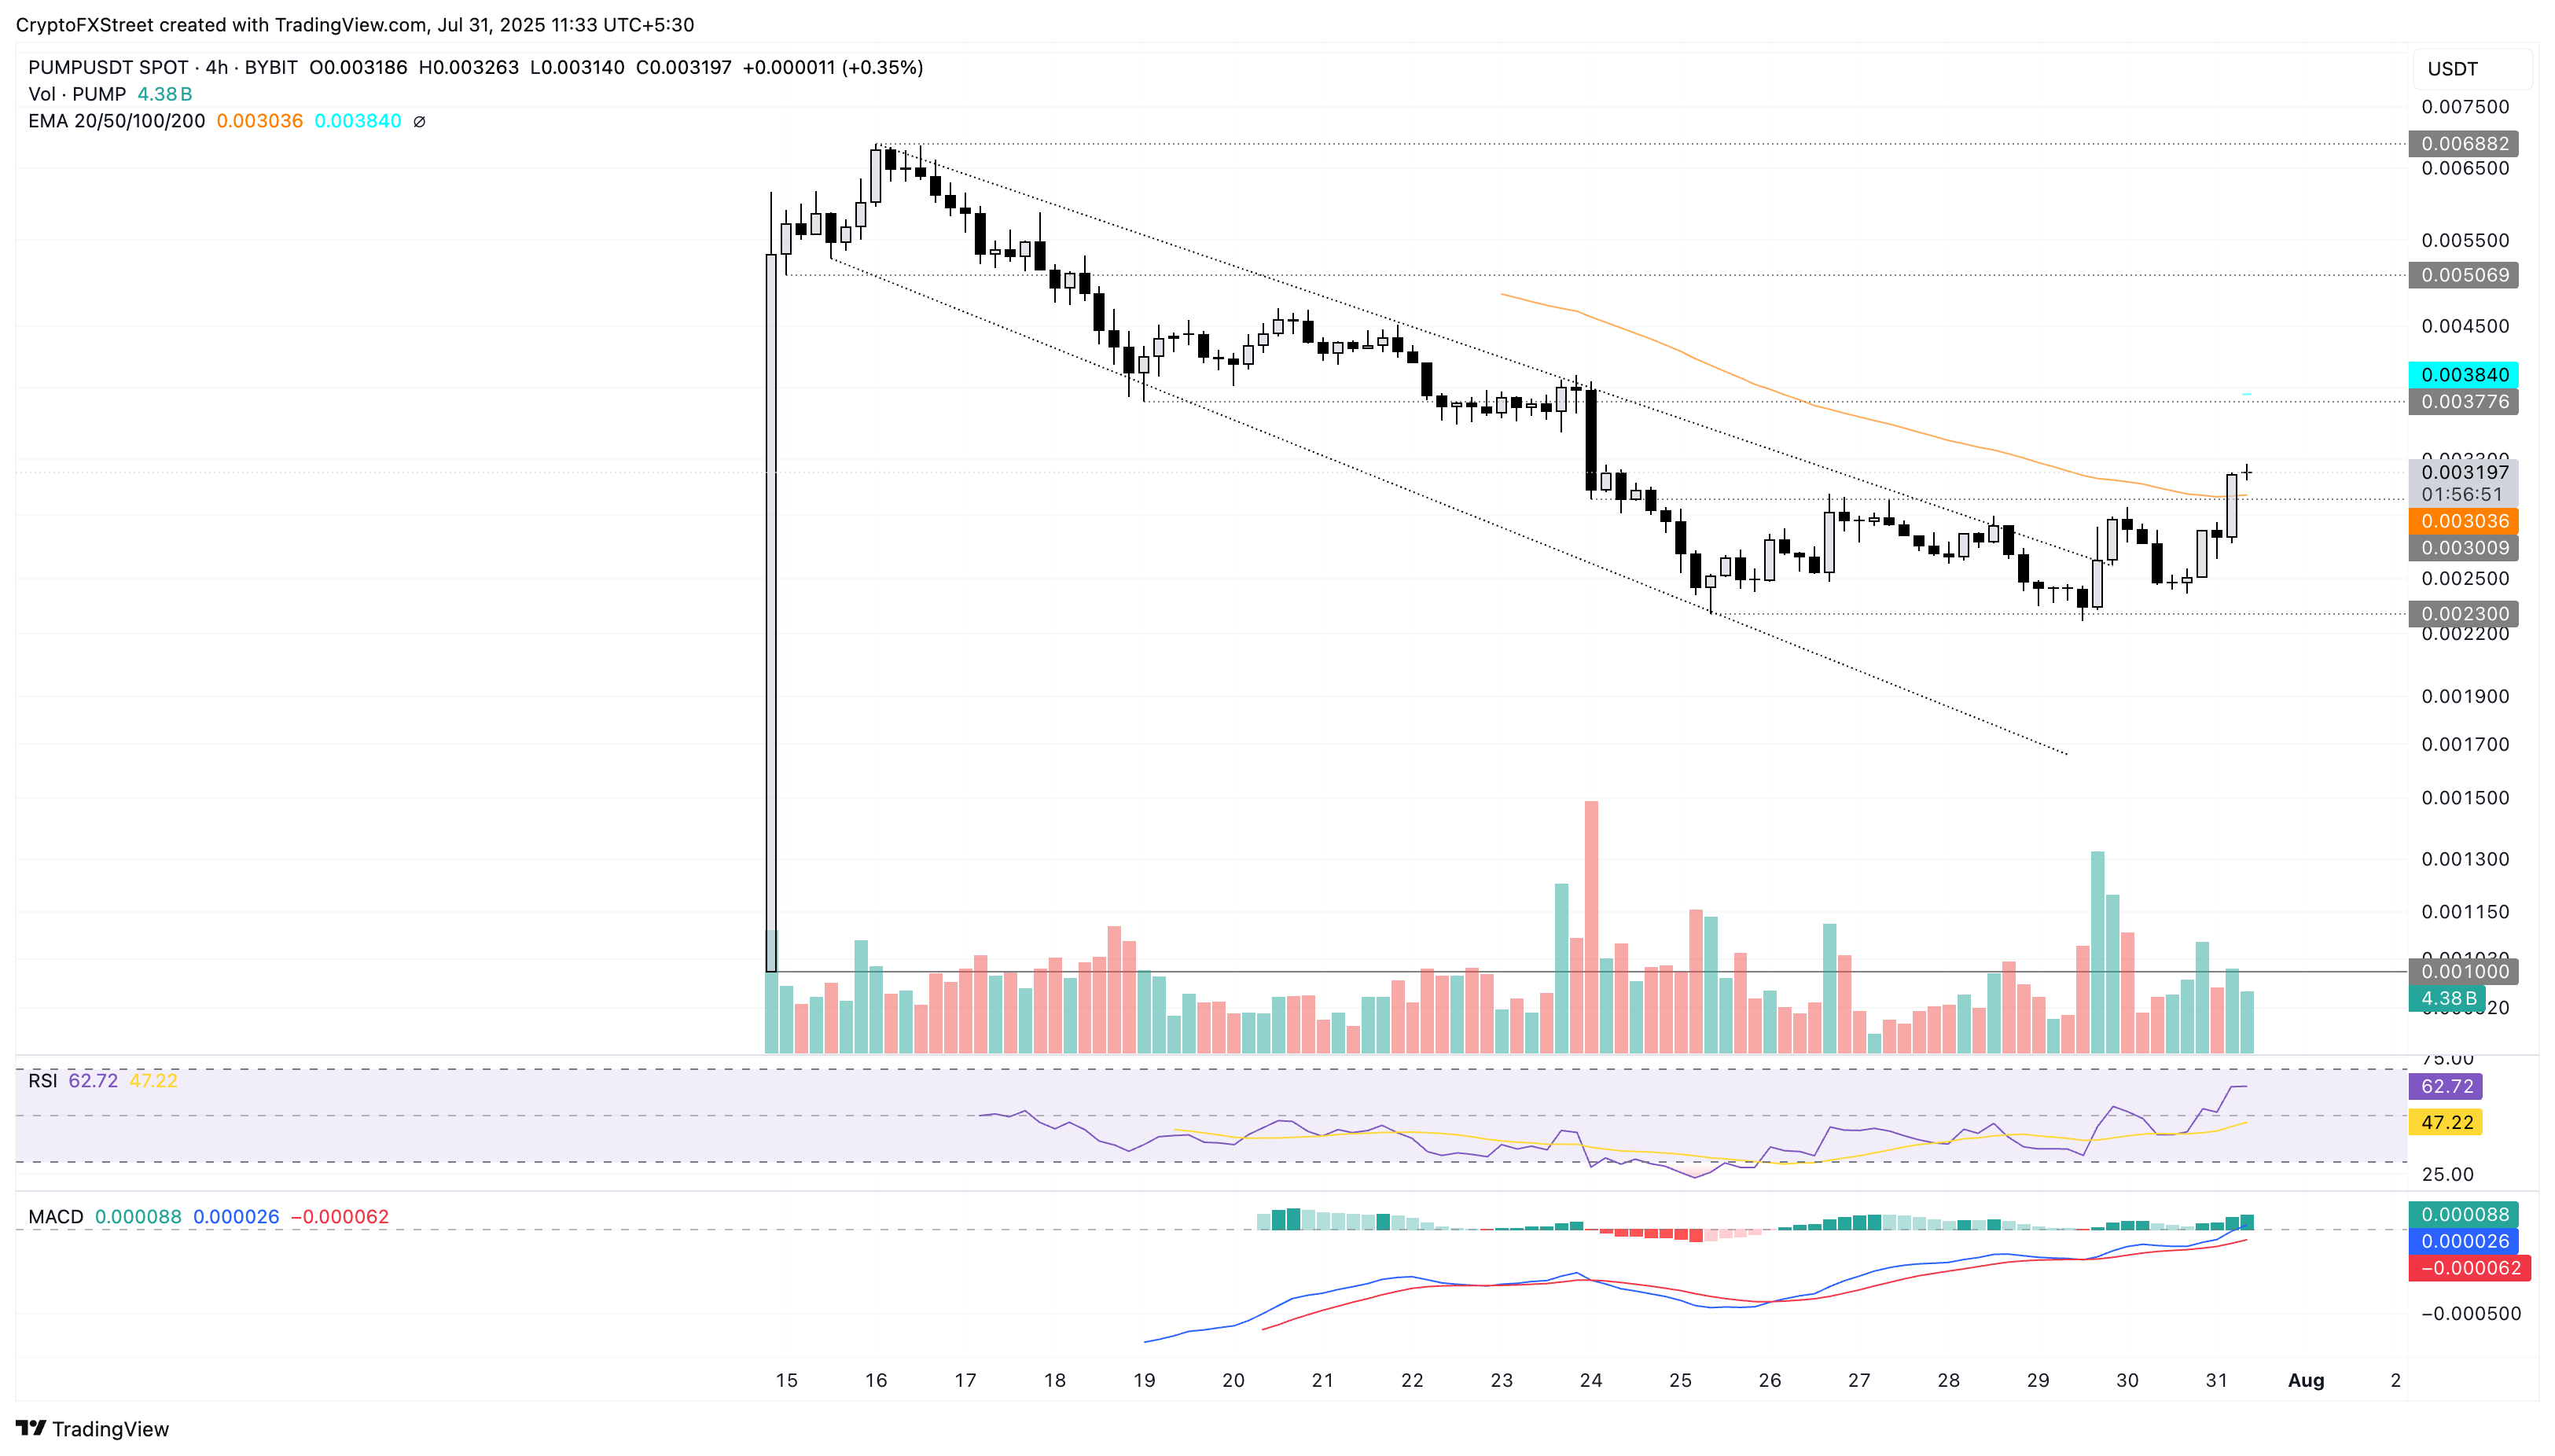
PUMP/USDT daily price chart.
On the downside, a reversal in the PUMP token below the $0.0030 level could extend the decline to $0.0023.
Ethena’s recovery regains momentum on the back of a Golden Cross
Ethena edges higher by 4% at press time on Thursday, following the recovery of over 6% from the previous day after testing the $0.5446 support level. ENA’s recovery run increases the Golden Cross pattern chances between the 50-day and 200-day Exponential Moving Averages (EMAs).
To reinforce the uptrend, Ethena must mark a decisive close above the $0.6576 weekly resistance, which could potentially extend the rally to $0.7982 level, last tested on January 31.
Investors should temper their bullish expectations as the MACD line inches closer to its signal line on the daily chart, indicating a potential crossover and sell signal. This aligns with the short-term volatility in Ethena and the $0.5446 level retest.
Still, the RSI reads 69 on the same chart, signaling heightened buying pressure.
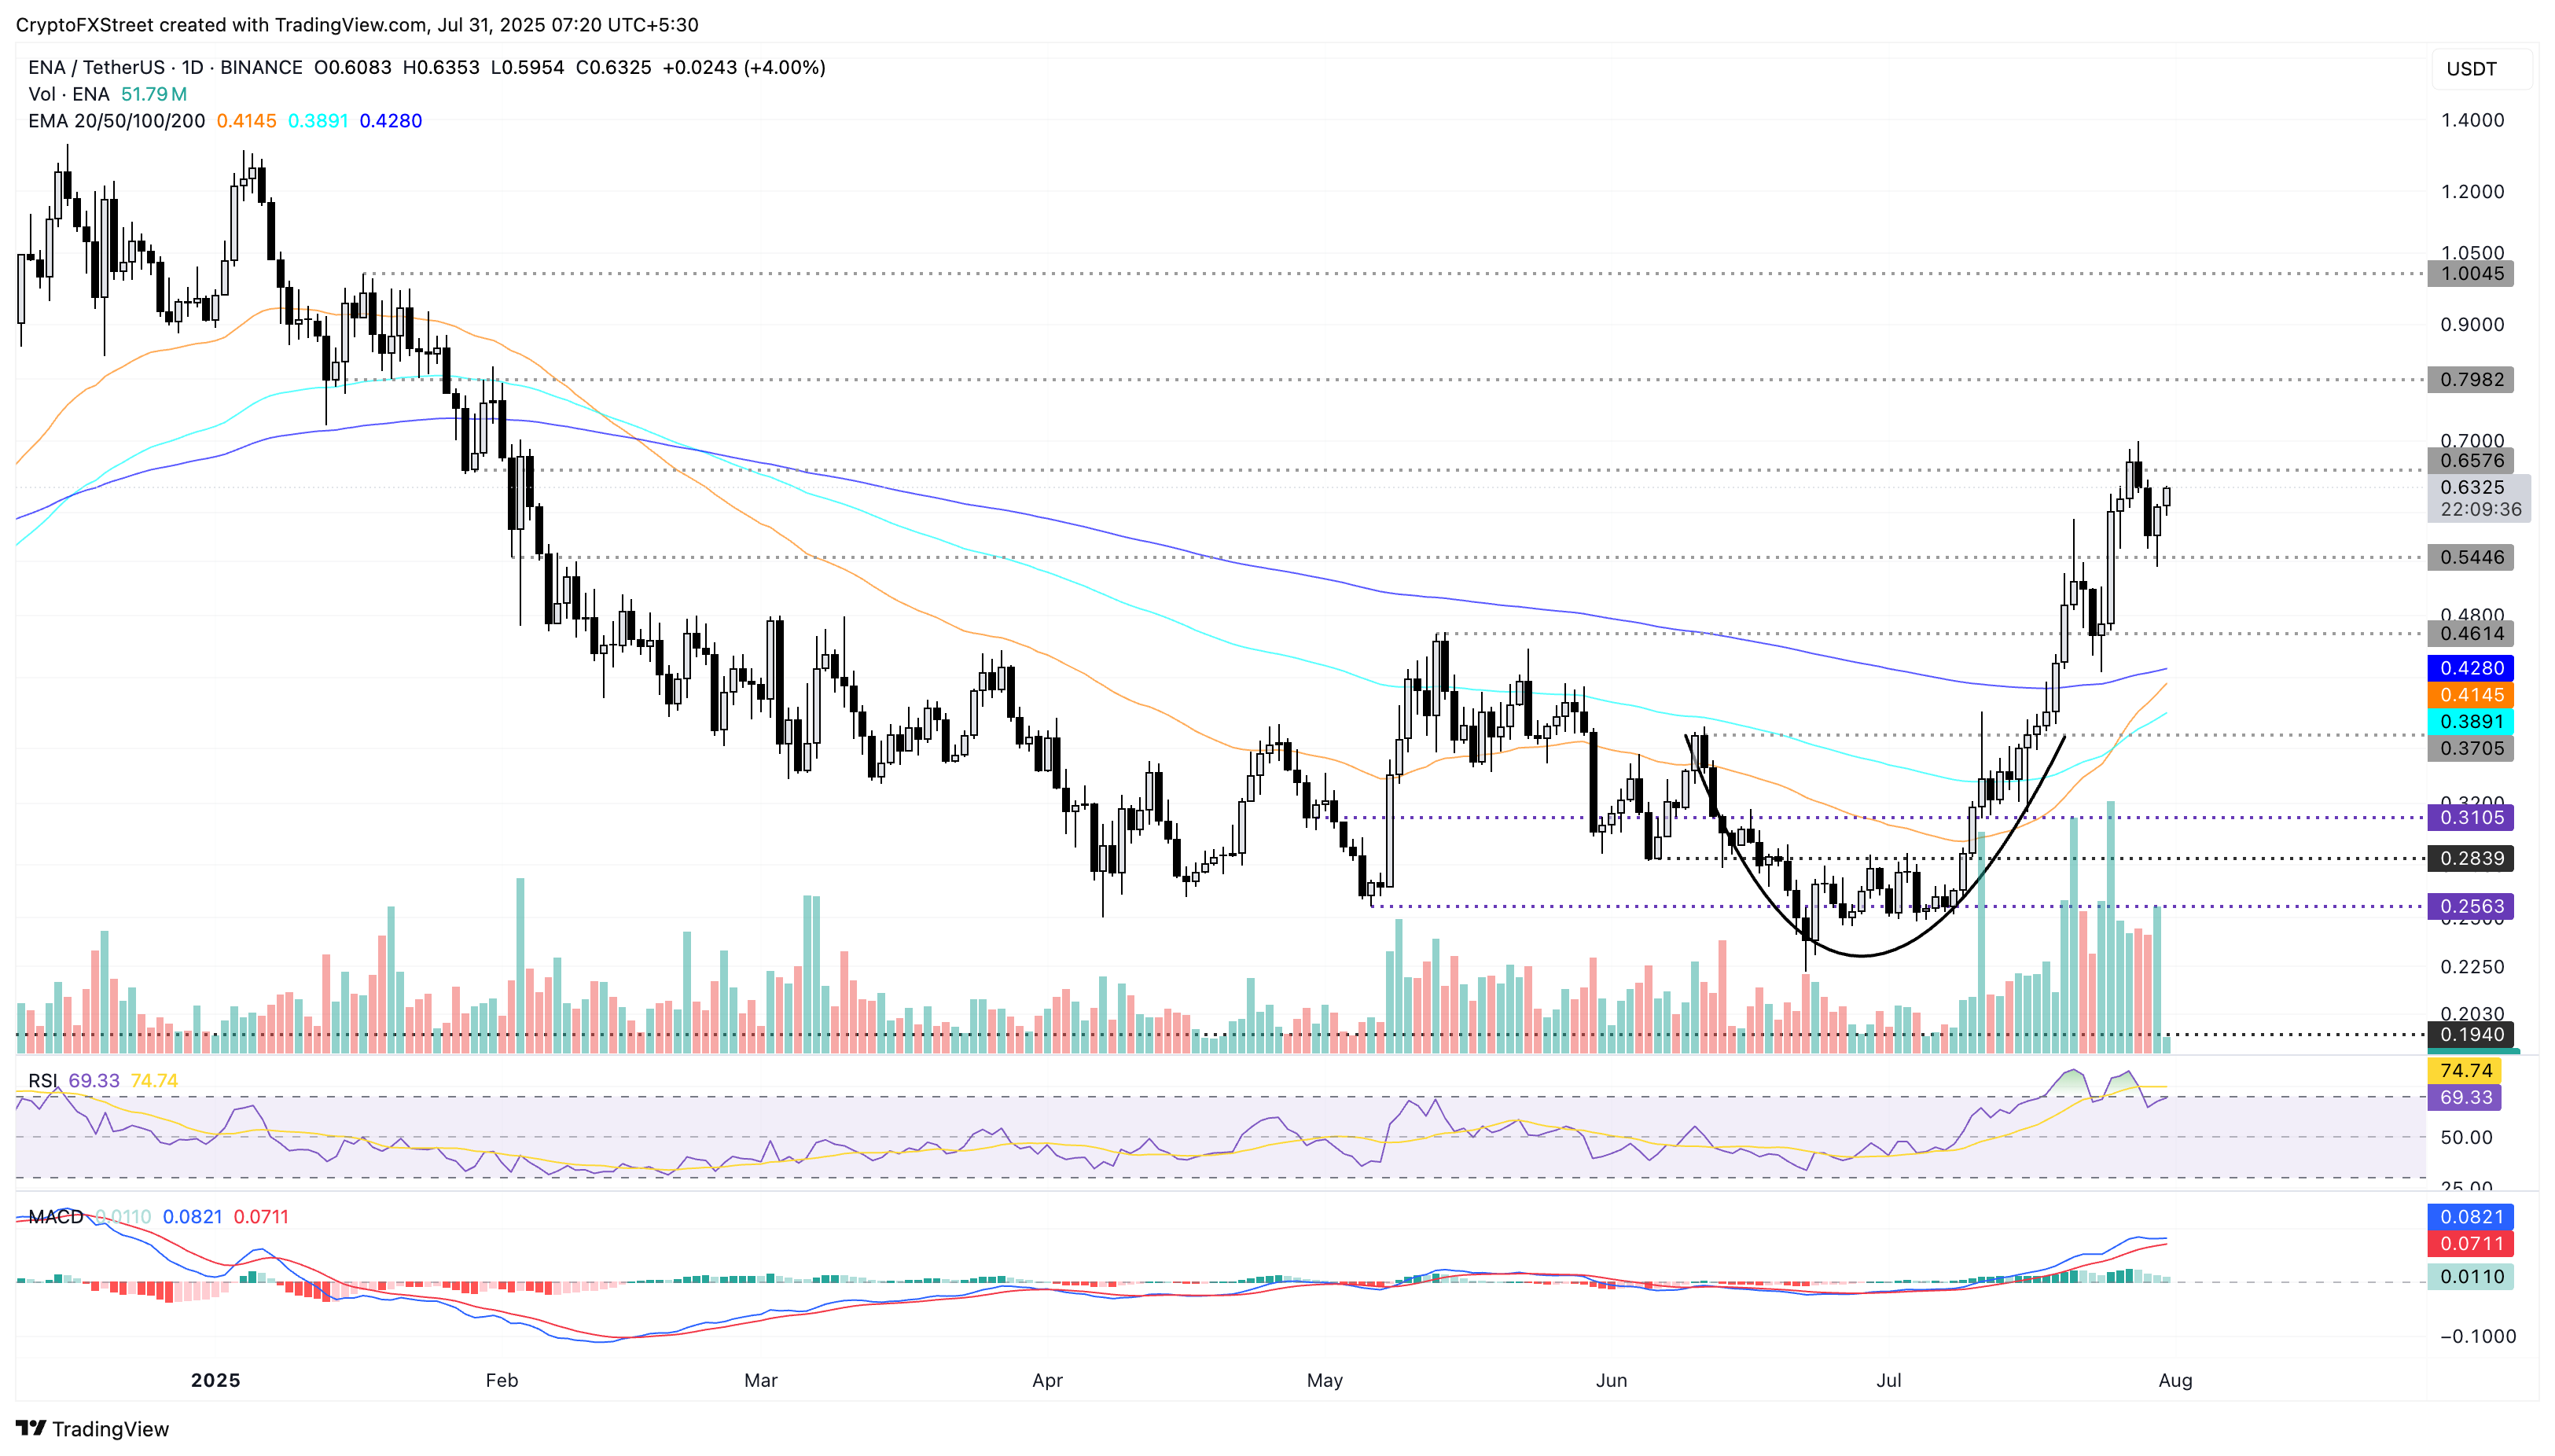
ENA/USDT daily price chart.
On the flipside, if the $0.5446 level crumbles, it could extend the decline to $0.4614.
Sonic’s reversal within a wedge gains traction
Sonic’s S token holds above the $0.30 level, forming a long lower shadow bullish candle. At the time of writing, Sonic edges higher by over 4%, hinting at a potential Morning Star pattern.
Sonic’s reversal could retest the 50-day EMA at $0.3548, followed by the overhead trendline of a Falling Wedge pattern shared in the daily chart below, near $0.3700.
The MACD line could cross above its signal line in the upcoming sessions, indicating a shift in trend momentum. The RSI at 49 faces upside, indicating recovery in buying pressure, approaching neutral levels.
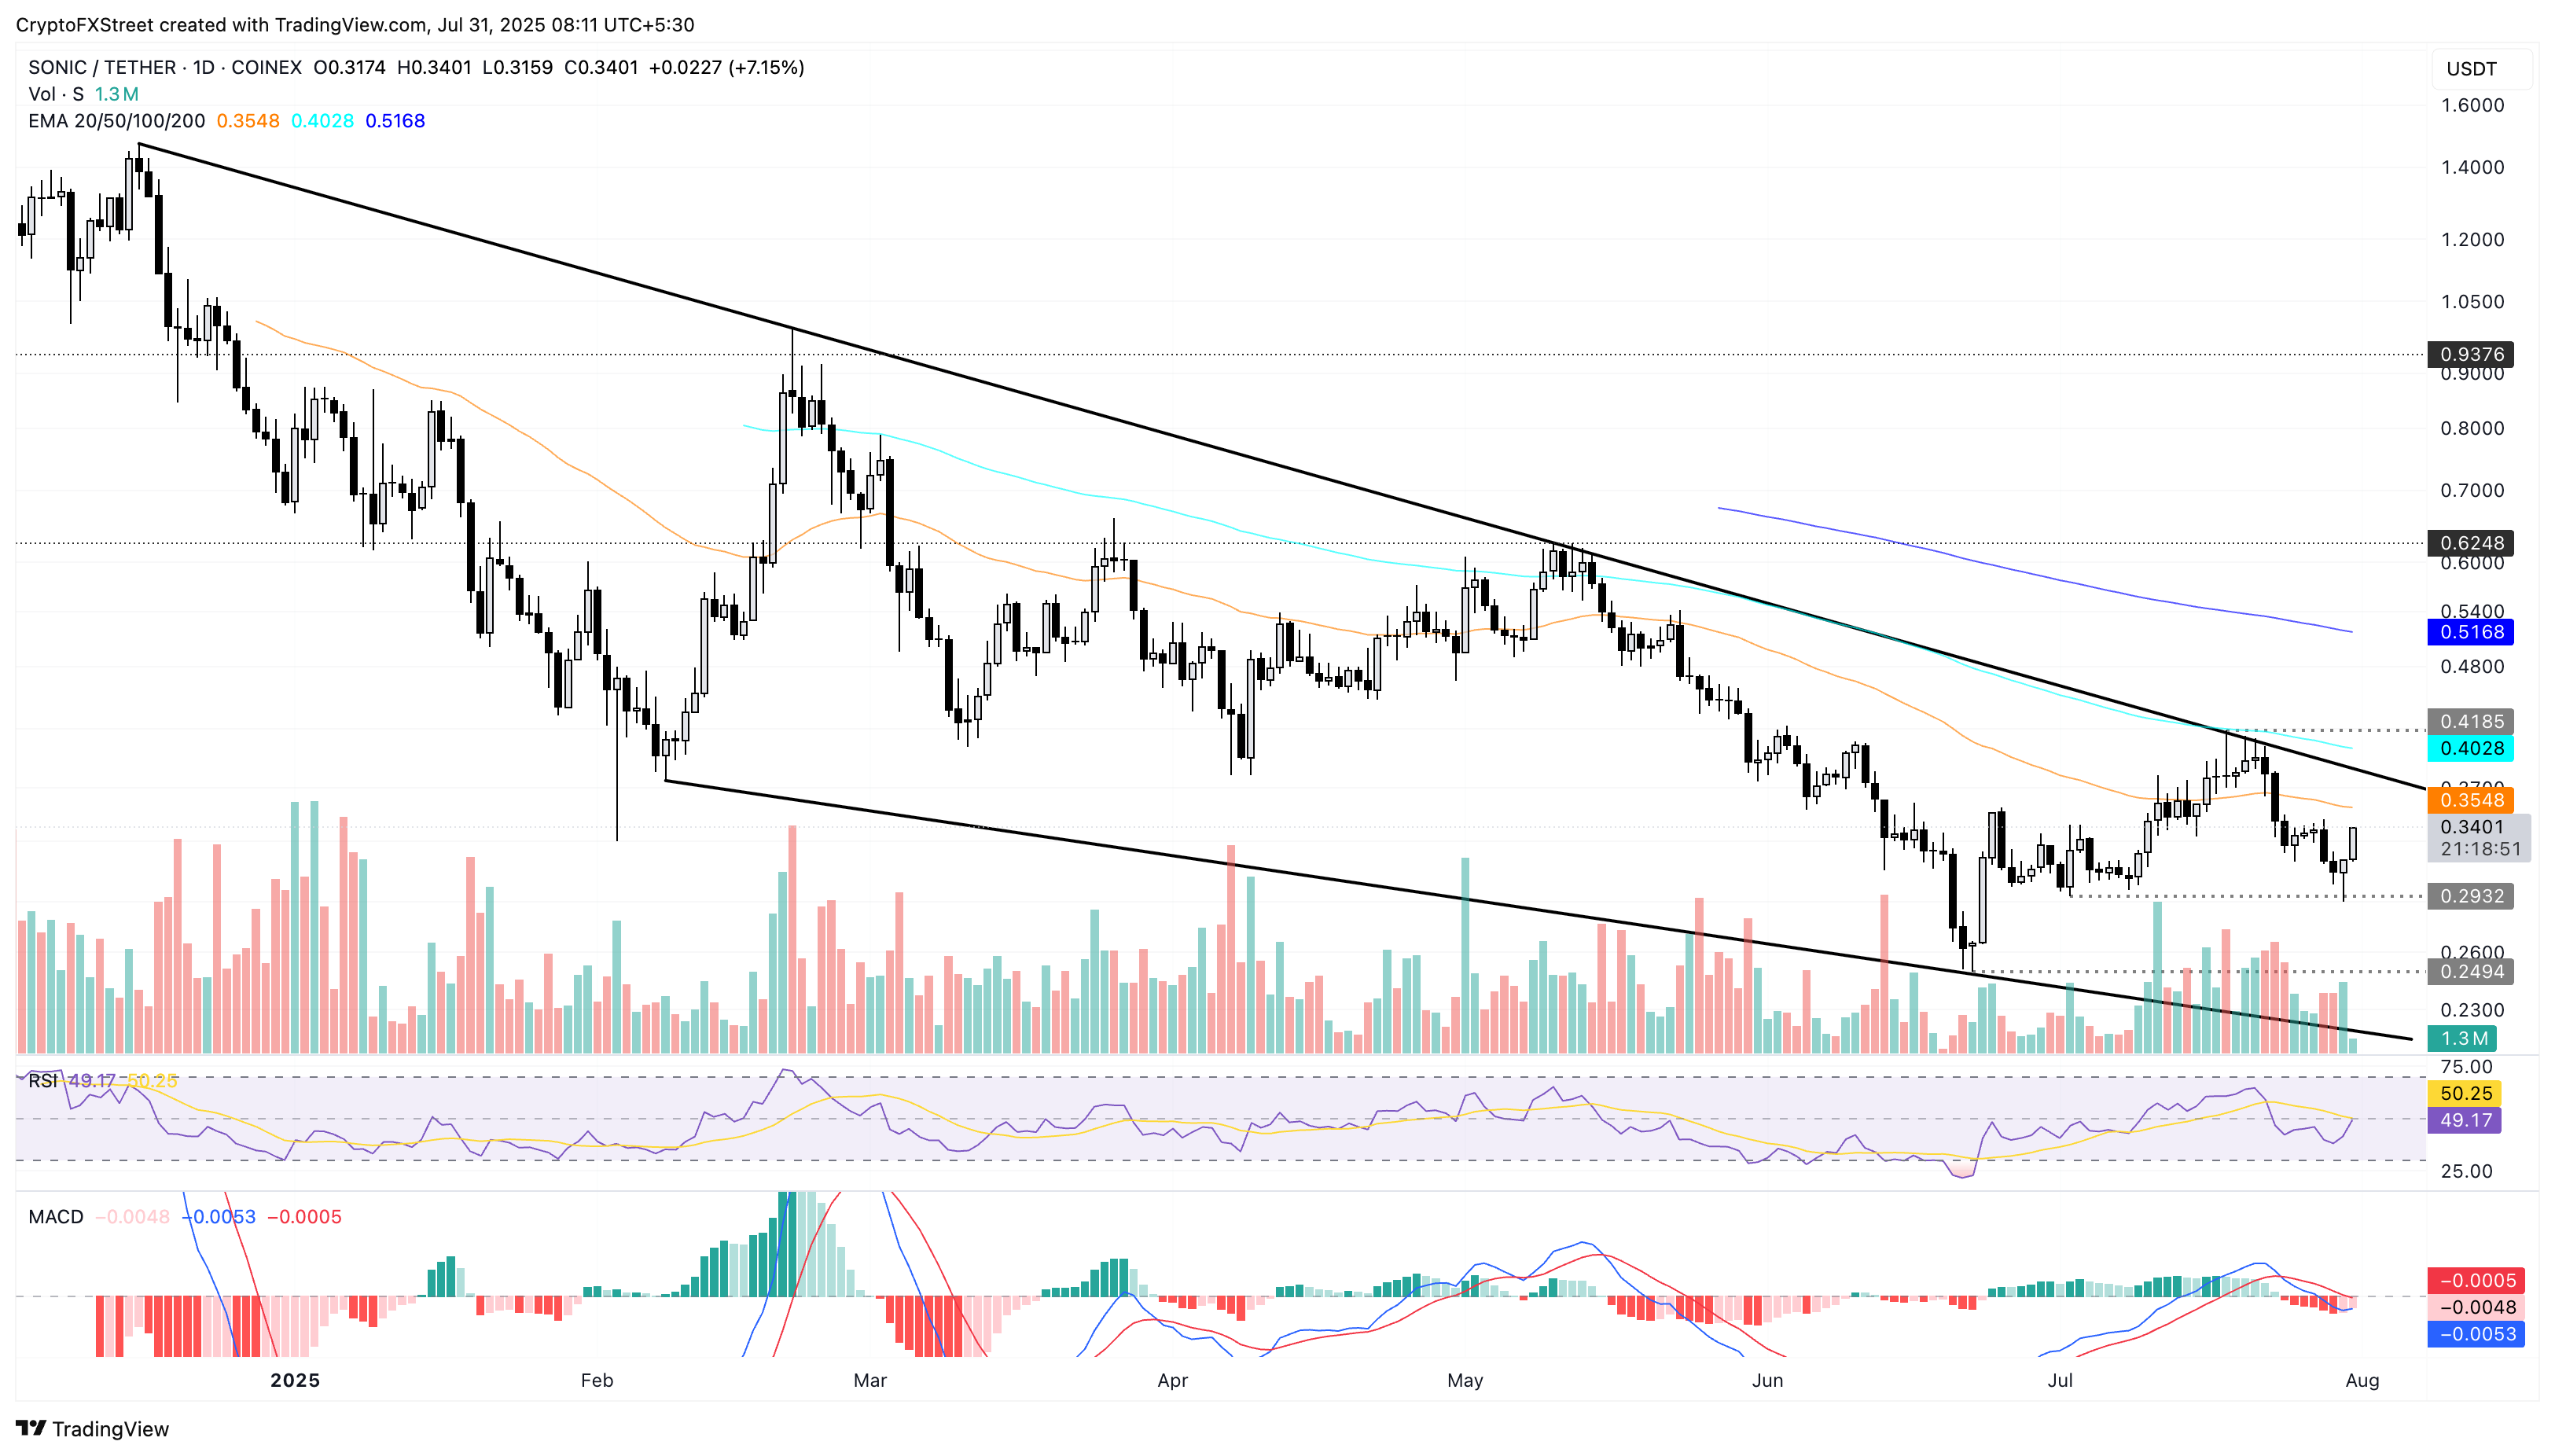
S/USDT daily price chart.
On the downside, a reversal in Sonic below the $0.2932 level could extend the downfall to $0.2494, marked by the June 22 low.
Recommended Articles


