


WTI Oil ready to crack $80 with OPEC prolonging output cuts
- WTI Oil jumps above $79 in European trading on Monday.
- Oil traders are positioning for more upside, with futures net long at highest since October.
- The US Dollar Index is retreating back below 104 with markets looking ahead of US Jobs Reports on Friday.
Oil prices are in the green this Monday morning, backed by headlines that came out over the weekend confirming that OPEC will persist its production curbs for at least Q2, in line with expectations. Traders are seeing further bullish signs with the Commodity Futures Trading Commission (CFTC) noting speculative net long positions rising to the highest since October 2023. The OPEC cuts were voluntary, with recent data pointing to a dramatic rise in February versus January. More countries will be reporting in the coming days.
Meanwhile, the US Dollar Index (DXY) is easing on Monday with the Euro being on the forefront ahead of the European Central Bank Meeting this week. For the US Dollar, all eyes will be on US Federal Reserve Chairman Jerome Powell who will undergo his semi-annual statement before Capitol Hill (and the grilling by Senator Elizabeth Warren). That comes ahead of the US Jobs Report, which is facing high expectations after the upbeat surprise in February.
Crude Oil (WTI) trades at $79.66 per barrel, and Brent Oil trades at $83.60 per barrel at the time of writing.
Oil news and market movers: OPEC communicates as expected
- OPEC+ agrees to extend its current supply curbs in order to meet the oversupply from the US that is hitting the markets.
- Canada’s newest and biggest Oil pipeline is set to come online in the coming weeks, according to MEG Energy Corp.
- According to a Bloomberg Survey, despite the production cuts, other OPEC members are pumping above average: Libya saw its production in February rise by 120 million barrels, which is 11.2% of monthly increase as it resumed production from its Sahara Oil field. Nigeria rose by 2% in February.
- Iraq and the United Arab Emirates (UAE) are currently pumping up near 400 million barrels per day above target.
Oil Technical Analysis: OPEC cuts have one big issue
Oil prices are cheerful after comments over the weekend from a few OPEC delegates and people close to the decision that was taking place. Although the cuts are welcomed in order to keep current price levels maintained, a small issue is arising with the countries that are not upholding any supply curbs, and are even jacking up their production even more. Add the already elevated supply out of the US, and it could be that OPEC will either have to ask internally to all countries to stick to their agreed quota’s or to have deeper supply cuts after Q2.
Oil bulls are clearly seeing more upside potential with, as mentioned in the article above, net speculative bullish bets soaring to the highest level since October of 2023. These speculators could well be sitting on their hands until Oil prices finally reach $85 again. with $86.90 quickly following suit before targeting $89.64 and $90.00 as top levels.
On the downside, the 200-day Simple Moving average (SMA) near $77.76 is the first point of contact to provide some support. Quite close behind are the 100-day and the 55-day SMAs near $76.19 and $74.96, respectively. Add the pivotal level near $75.27, and it looks like the downside is very limited and well-equipped to resist the selling pressure..
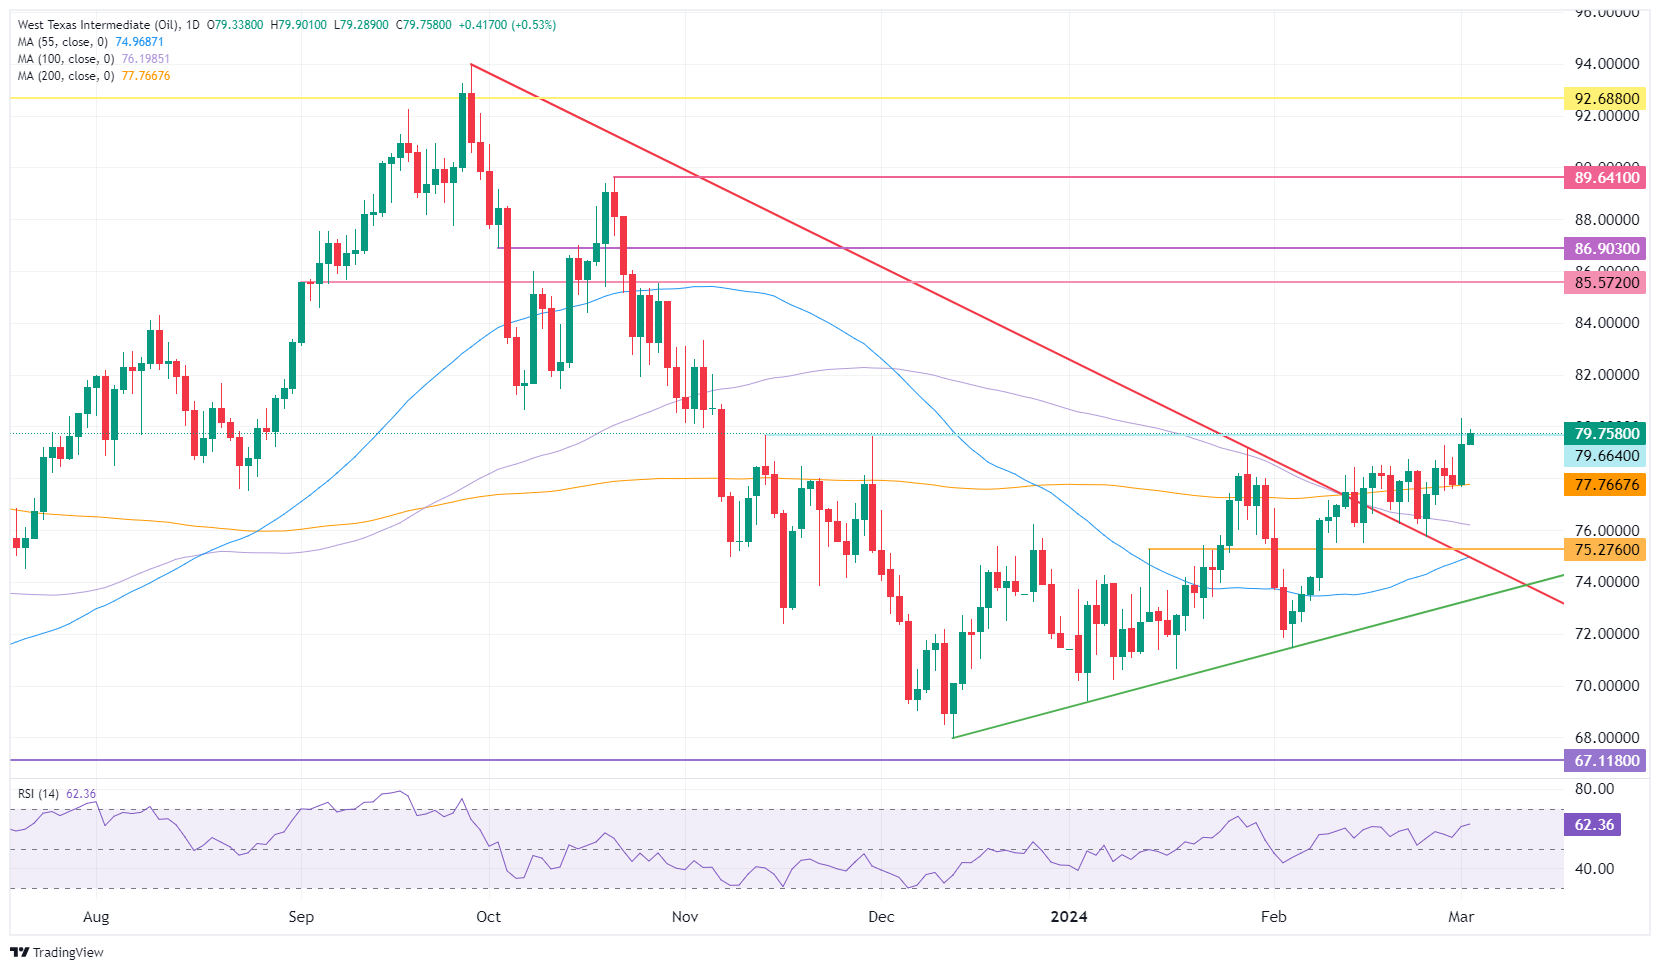
US WTI Crude Oil: Daily Chart
WTI Oil FAQs
What is WTI Oil?
WTI Oil is a type of Crude Oil sold on international markets. The WTI stands for West Texas Intermediate, one of three major types including Brent and Dubai Crude. WTI is also referred to as “light” and “sweet” because of its relatively low gravity and sulfur content respectively. It is considered a high quality Oil that is easily refined. It is sourced in the United States and distributed via the Cushing hub, which is considered “The Pipeline Crossroads of the World”. It is a benchmark for the Oil market and WTI price is frequently quoted in the media.
What factors drive the price of WTI Oil?
Like all assets, supply and demand are the key drivers of WTI Oil price. As such, global growth can be a driver of increased demand and vice versa for weak global growth. Political instability, wars, and sanctions can disrupt supply and impact prices. The decisions of OPEC, a group of major Oil-producing countries, is another key driver of price. The value of the US Dollar influences the price of WTI Crude Oil, since Oil is predominantly traded in US Dollars, thus a weaker US Dollar can make Oil more affordable and vice versa.
How does inventory data impact the price of WTI Oil
The weekly Oil inventory reports published by the American Petroleum Institute (API) and the Energy Information Agency (EIA) impact the price of WTI Oil. Changes in inventories reflect fluctuating supply and demand. If the data shows a drop in inventories it can indicate increased demand, pushing up Oil price. Higher inventories can reflect increased supply, pushing down prices. API’s report is published every Tuesday and EIA’s the day after. Their results are usually similar, falling within 1% of each other 75% of the time. The EIA data is considered more reliable, since it is a government agency.
How does OPEC influence the price of WTI Oil?
OPEC (Organization of the Petroleum Exporting Countries) is a group of 13 Oil-producing nations who collectively decide production quotas for member countries at twice-yearly meetings. Their decisions often impact WTI Oil prices. When OPEC decides to lower quotas, it can tighten supply, pushing up Oil prices. When OPEC increases production, it has the opposite effect. OPEC+ refers to an expanded group that includes ten extra non-OPEC members, the most notable of which is Russia.
Recommended Articles


