

WTI rallies, en route to $79.00 after EIA Crude Oil inventories slightly miss forecasts
- Crude Oil markets on the rebound on Thursday after supplies ease.
- Distillate inventories showed a surprise drop, fueling a bounce.
- Geopolitical tensions are mixed, with a possible Gaza ceasefire on the table.
West Texas Intermediate (WTI) US Crude Oil rallied on Thursday as energy markets find relief from Energy Information Administration (EIA) barrel counts came in just below forecasts, and eased back from a previous 12 million-plus barrel supply count.
EIA Distillate Inventories declined a little over 4 million barrels, sparking a relief rally in Crude Oil, and the EIA’s Crude Oil Inventories rose 3.514 million barrels for the week ended February 16 compared to the forecast 3.75 million barrels. The below-forecast barrel count sent prices higher as barrel traders shrug off the previous EIA barrel counts, as well as the American Petroleum Insititute’s (API) Weekly Crude Oil Stocks count of 7.168 million released on Wednesday.
According to the EIA, overall US gasoline production averaged 9 million barrels per day over the week, down slightly from the previous week’s 9.2 million bpd.
Geopolitical tensions eased slightly early Thursday as there are signs that a hostage exchange and possible ceasefire negotiation is still on the table in the ongoing Gaza conflict between Israel and Palestinian Hamas. Tensions rose immediately after when Iranian-backed Houthi rebels in Yemen declared that they will continue to target civilian vessels in the Red Sea, and intend to step up the rate of attacks.
Yemeni Houthis have declared that they expanded the scope of ships they plan to attack, and are now including American and UK-owned vessels that they find crossing the Suez Canal.
WTI technical outlook
US Crude Oil rallied over 2% bottom-to-top on Thursday, lifting from above the $77.00 handle to clear $78.00, and WTI is poised to reclaim $79.00. Thursday’s rally saw a clean bounce from the 200-hour Simple Moving Average (SMA) near $77.35.
WTI has risen to its highest bids since late January, and US Crude Oil has closed higher or flat for all but two of the last fourteen consecutive trading days.
Thursday’s rise in barrel bids also sees WTI set for a bullish extension above the 200-day SMA near $77.60, and the nearest swing high sits at January’s late peak at $79.20.
WTI hourly chart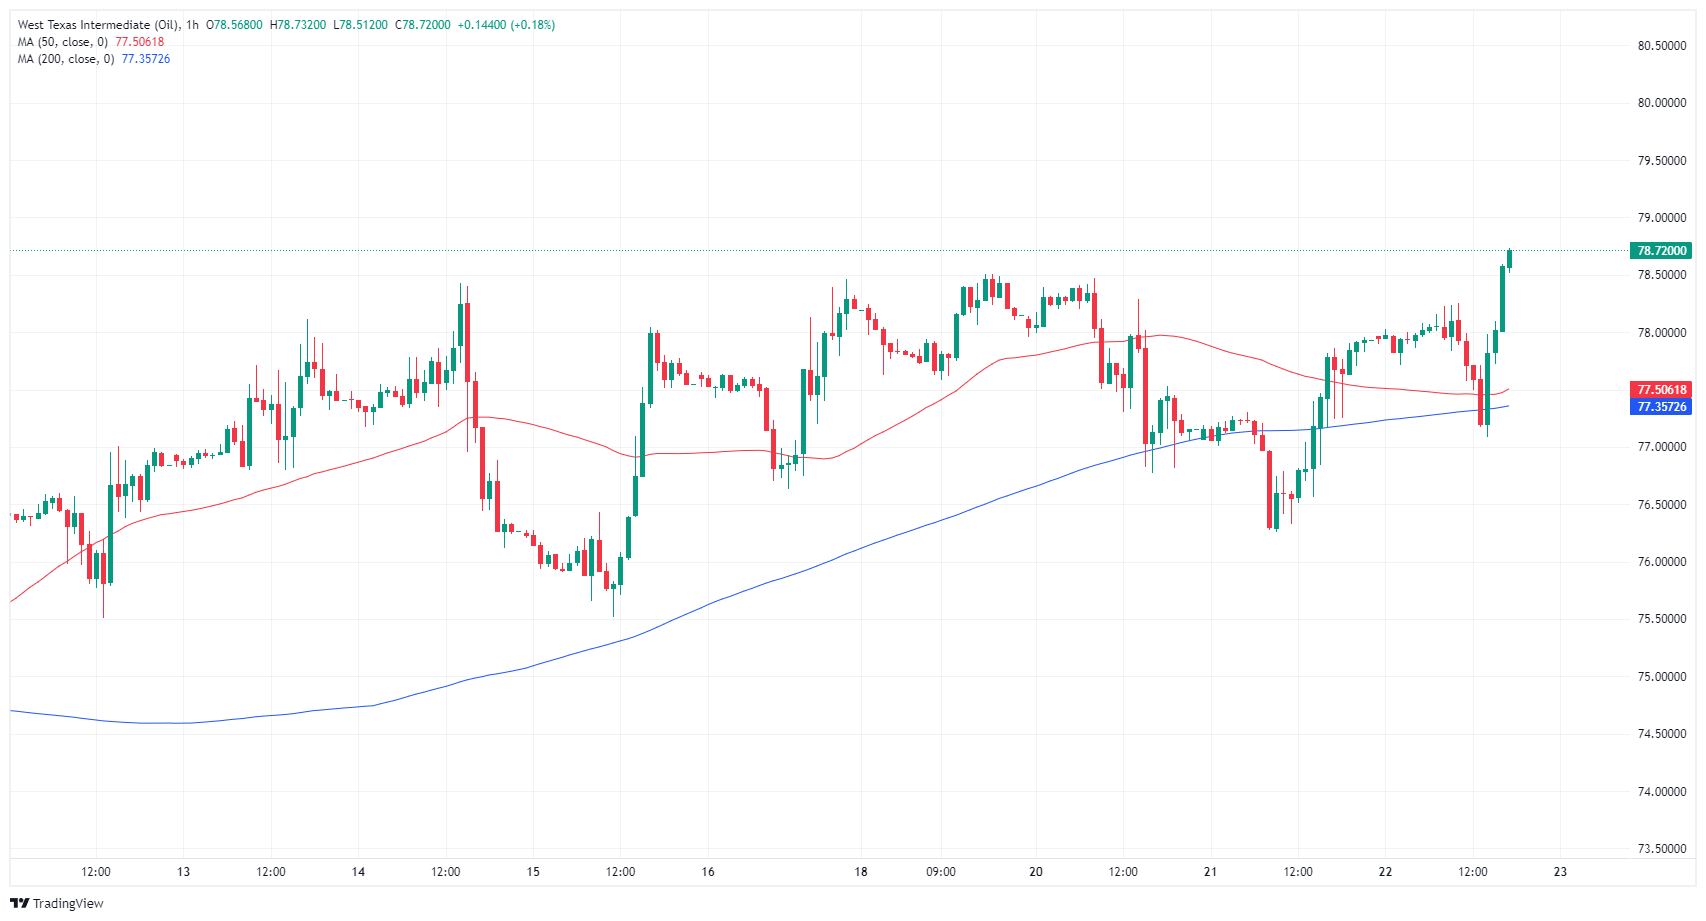
WTI daily chart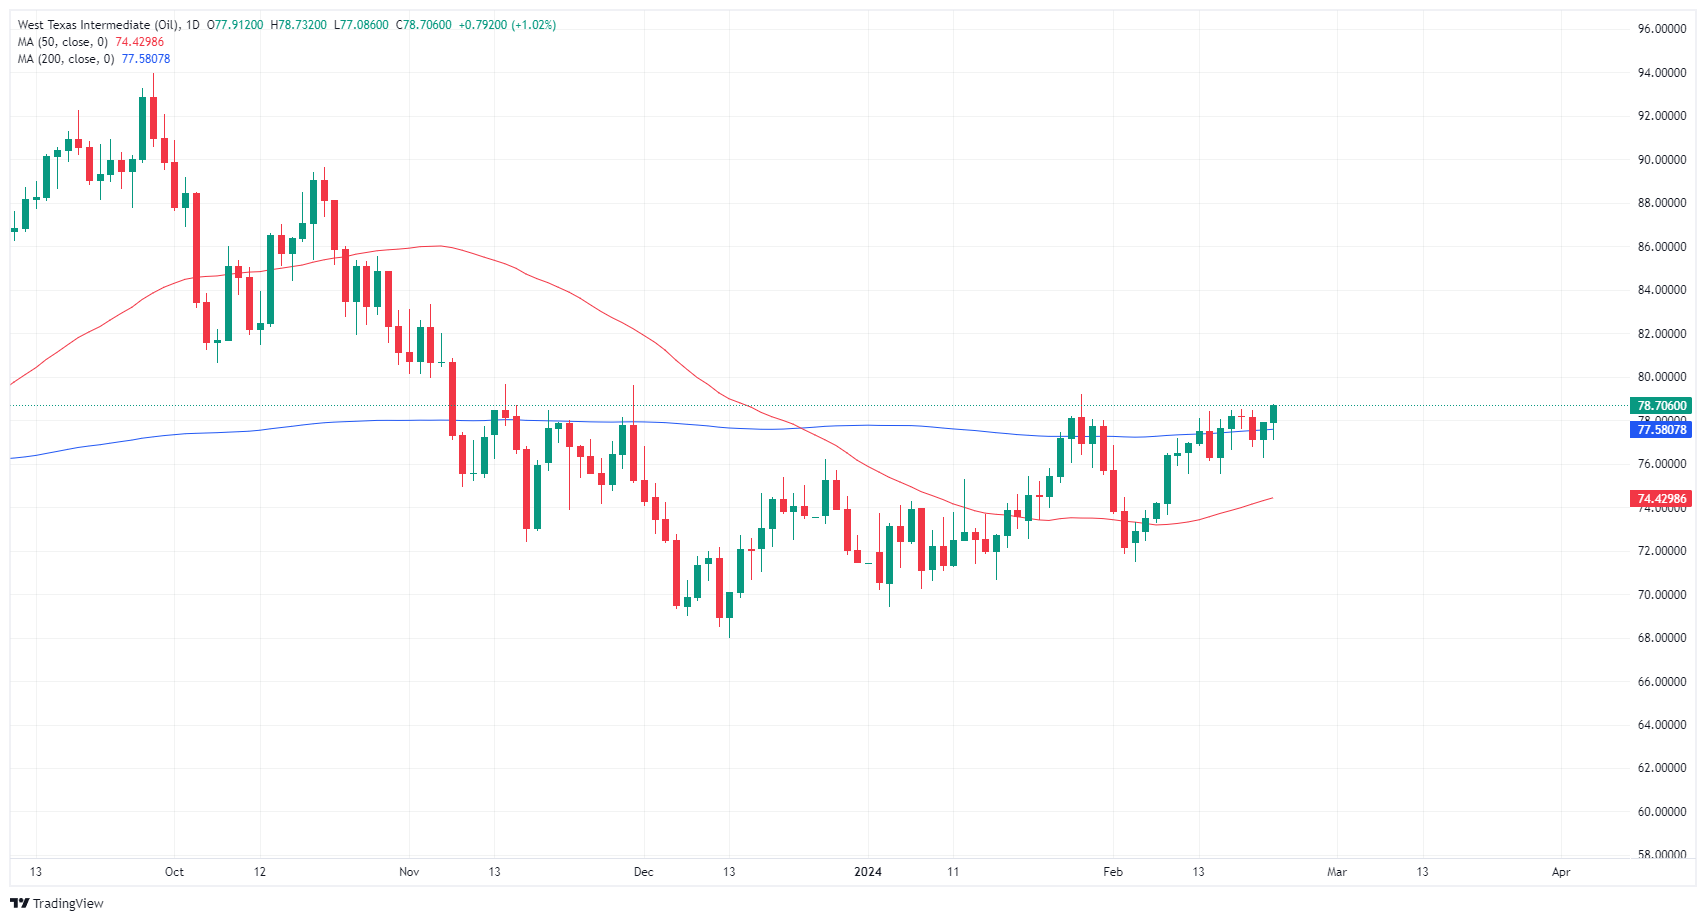
Recommended Articles


