

Natural Gas heading into low-price regime
- Natural Gas keeps retreating with more bearish elements in the mix.
- Traders are pushing gas to substantial lower levels which could mean longer term low pricing.
- The US Dollar Index is flat for this week’s performance ahead of PPI and Michigan numbers.
Natural Gas (XNG/USD) is trading back around $1.65 and is facing more downward pressure. Recent US data shows that demand for Gas is now not only abating in Europe, but also in the US. The decline towards $1.50 could mean that Gas prices are heading into a region of substantially lower pricings for longer with redundancy at peak levels against tepid global demand.
The US Dollar (USD) meanwhile has eased back to its entry level from Monday. The underperforming Retail Sales print from Thursday was enough to erase the red-hot inflation print from Tuesday. Traders are gearing up to close the US Dollar Index (DXY) either at a loss or a profit on the back of US Producer Price Index (PPI) numbers and University of Michigan numbers.
Natural Gas is trading at $1.65 per MMBtu at the time of writing.
Natural Gas market movers: World growth stalling demands repricing
- Eni has released its fourth quarter profit, which matched estimates. One big element in the report was that the profits from the Natural Gas business were enough to cover the weakness in the refining and chemicals branch.
- Associated Press said that blasts have hit a Natural Gas Pipeline in Iran, near Bakhtiari province. Iranian officials confirmed that it was an act of sabotage.
- Even over the weekend higher-than-normal temperatures are heading over the European continent, limiting short-term draws of Gas out of the storage facilities.
- European gas storages are still 66% full, above the 5-year average of 50% for this time of year.
Natural Gas Technical Analysis: RSI defies logic
Natural Gas is struggling to find any platforms to bounce off. More short term and long term issues are arising for the energy commodity with short term global growth starting to abate, which means less demand. In the longer term, the shift away from fossil fuels means less demand. So a longer-term repricing where Natural Gas might not make its way back up above $2.00 could be on the horizon, and which pushes the Relative Strength Index (RSI) in an “oversold” regime for longer.
On the upside, Natural Gas is facing some pivotal technical levels to get back to. First stop is $1.99, – the level which, when broken, saw an accelerated decline. Next is the blue line at $2.13 with the triple bottoms from 2023. In case Natural Gas sees sudden demand pick up, possibly $2.40 could come into play.
Keep an eye on $1.80, which was a pivotal level back in July 2020 and should act as a cap now. Should more supply emerge in the markets, or more weakening data globally point to even more sluggish global growth – $1.64 and $1.53 (the low of 2020) are targets to look out for.
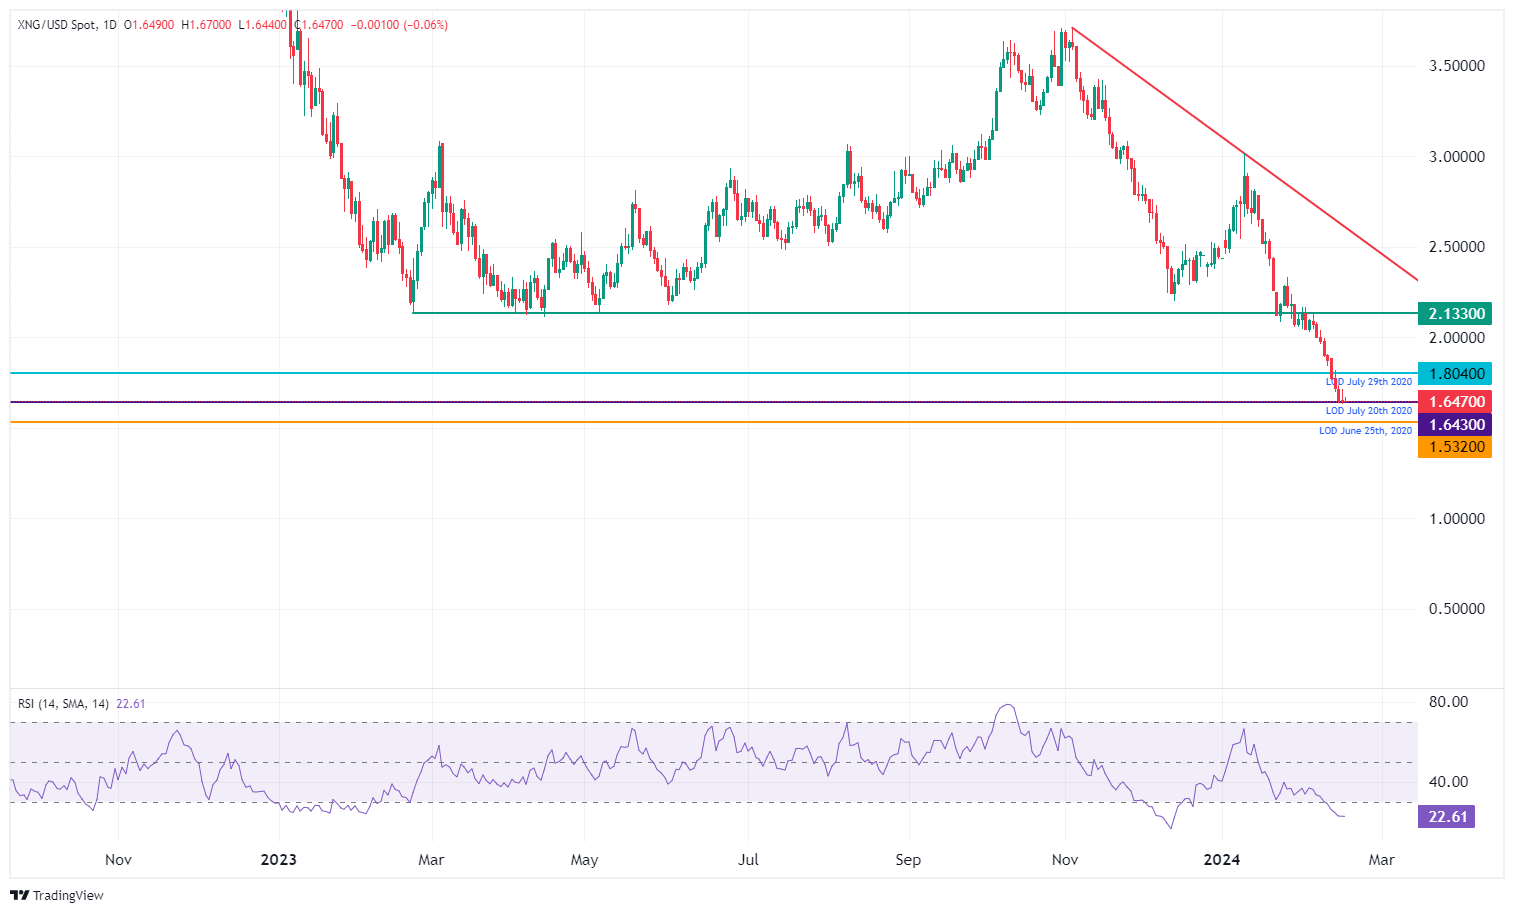
XNG/USD (Daily Chart)
Natural Gas FAQs
What fundamental factors drive the price of Natural Gas?
Supply and demand dynamics are a key factor influencing Natural Gas prices, and are themselves influenced by global economic growth, industrial activity, population growth, production levels, and inventories. The weather impacts Natural Gas prices because more Gas is used during cold winters and hot summers for heating and cooling. Competition from other energy sources impacts prices as consumers may switch to cheaper sources. Geopolitical events are factors as exemplified by the war in Ukraine. Government policies relating to extraction, transportation, and environmental issues also impact prices.
What are the main macroeconomic releases that impact on Natural Gas Prices?
The main economic release influencing Natural Gas prices is the weekly inventory bulletin from the Energy Information Administration (EIA), a US government agency that produces US gas market data. The EIA Gas bulletin usually comes out on Thursday at 14:30 GMT, a day after the EIA publishes its weekly Oil bulletin. Economic data from large consumers of Natural Gas can impact supply and demand, the largest of which include China, Germany and Japan. Natural Gas is primarily priced and traded in US Dollars, thus economic releases impacting the US Dollar are also factors.
How does the US Dollar influence Natural Gas prices?
The US Dollar is the world’s reserve currency and most commodities, including Natural Gas are priced and traded on international markets in US Dollars. As such, the value of the US Dollar is a factor in the price of Natural Gas, because if the Dollar strengthens it means less Dollars are required to buy the same volume of Gas (the price falls), and vice versa if USD strengthens.
Recommended Articles


