

Gold price draws attention amidst swelling global inflation woes
- Gold price pops above $2,660 and tries to consolidate above the level.
- Traders are sending yields higher in concerns over inflation overheating again.
- Gold price looks to enter a similar moment as seen in 2023 with the SVB meltdown.
Gold’s price (XAU/USD) consolidates above the key level of $2,660 on Thursday after breaking and closing above the 55-day Simple Moving Average (SMA) at $2,654 the previous day. The move comes as yields across the globe start to surge due to inflation concerns. Traders are getting worried that inflation could peak again with all the stimulus plans, fiscal reforms, and tariff levies that President-elect Donald Trump has announced in the past few days and weeks.
On the economic data front, this Thursday, all eyes are on the Federal Reserve (Fed), which has a slew of policymakers lined up to speak. Overnight, the Fed Minutes of the December meeting did not provide any new facts on rate expectations for 2025. Meanwhile, markets will keep an eye on Bitcoin, which has sold off substantially this week while yields are soaring. This creates the same set of parameters as in 2023, which resulted in the bankruptcy of the Silicon Valley Bank.
Daily digest market movers: Here comes the Fed to guide markets
- US stock markets will remain closed on Thursday, observing a National Day of Mourning in honor of former President Jimmy Carter. The bond market will operate on a shortened schedule, closing early.
- A $22 billion in 30-year Treasury reopening was awarded at 4.913% vs. 4.920% when-issued yield at the 1 p.m. New York time bidding deadline, the highest result since 2007, Bloomberg reports.
- US yields are softening a touch, with the 10-year benchmark at 4.673%, off the fresh nine-month high of 4.728% seen on Wednesday.
- The reshuffle and pushback in rate cut expectations from June to July in the CME FedWatch tool falls in line with the release of the Fed Minutes on Wednesday, where Fed officials confirmed a gradual and possibly longer steady rate before considering cut further, Bloomberg reported.
- At 14:00 GMT, Federal Reserve Bank of Philadelphia President Patrick Harker delivers a speech and participates in an audience Q&A at the Economic Forecast 2025 event organized by the National Association of Corporate Directors New Jersey Chapter.
- Around 17:40 GMT, Federal Reserve Bank of Richmond Thomas Barkin speaks to the Virginia Bankers Association and the Virginia Chamber of Commerce.
- At 18:30 GMT, Federal Reserve Bank of Kansas City President Jeff Schmid delivers a speech about the US economic and monetary policy outlook at an event organized by the Economic Club of Kansas City.
- At 18:35GMT, Federal Reserve Governor Michelle Bowman gives a speech reflecting on “2024: Monetary policy, economic performance and lessons for banking regulation.”
Technical Analysis: So far so good
The Gold price surge is making its way towards the resistance in the broader pennant chart formation. From here on out, it might start to get tricky, with $2,680 as a level to look out for. Once that level breaks, Gold prices could quickly sprint away to $2,700 and higher.
On the downside, the 55-day SMA at $2,654 should now be converted into support after it saw a daily close above it on Wednesday. Additionally, the 100-day Simple Moving Average (SMA) at $2,632 is holding again after a false break on Monday. Further down, the ascending trend line of the pennant pattern should provide support at around $2,612, as it did in the past three occasions. In case that support line snaps, a quick decline to $2,531 (August 20, 2024, high) could come back into play as support level.
On the upside, the descending trendline in the pennant chart formation at $2,680 is the first big upside level to watch. Once through there, $2,708 is the next pivotal level to look out for.
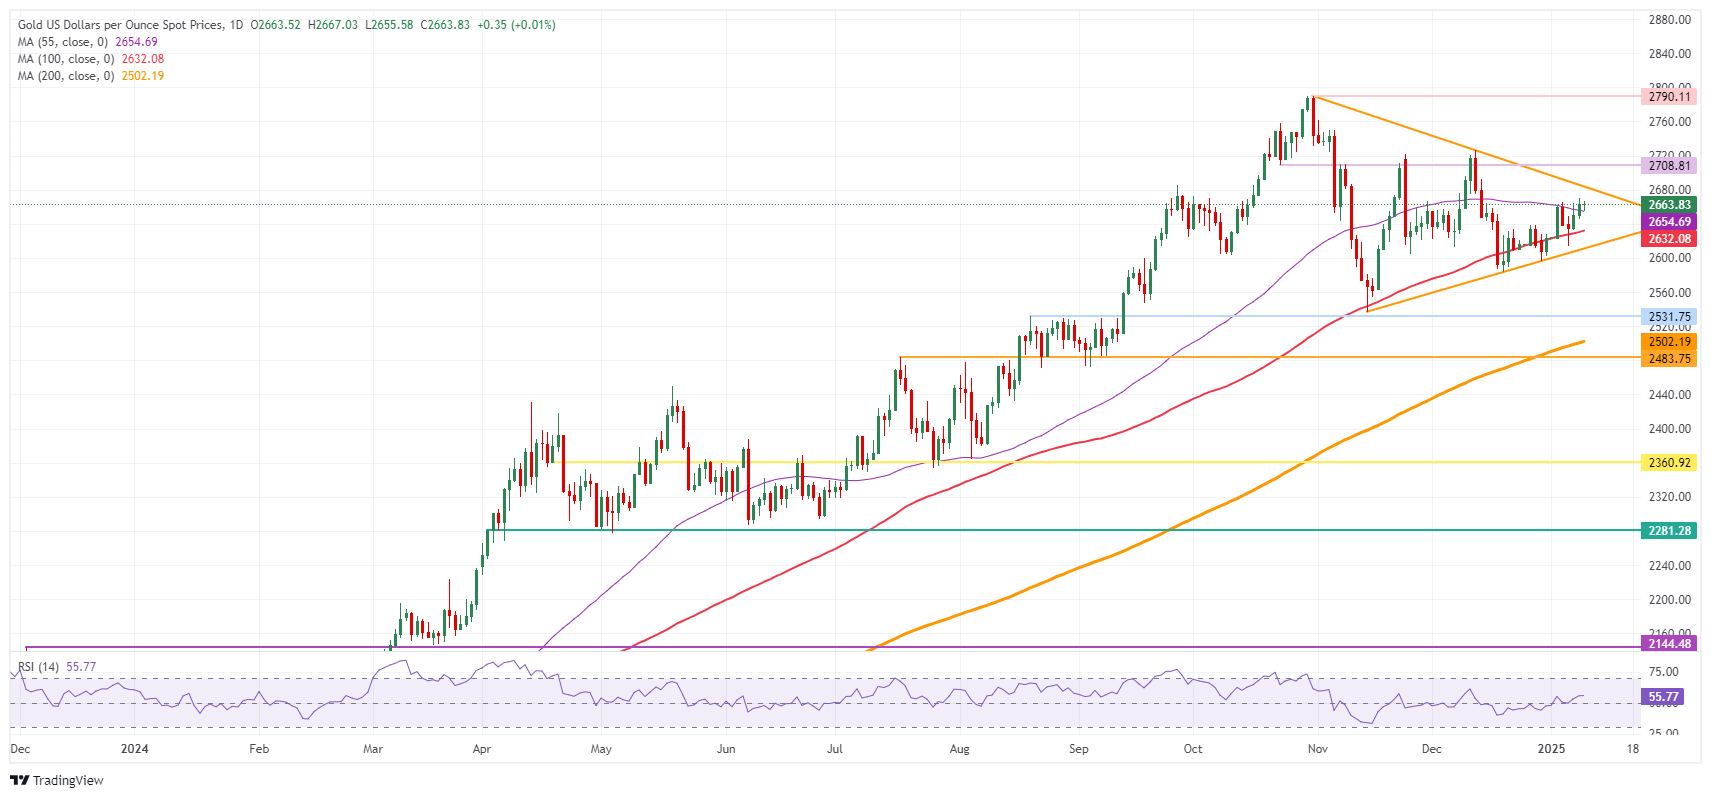
XAU/USD: Daily Chart
Gold FAQs
Gold has played a key role in human’s history as it has been widely used as a store of value and medium of exchange. Currently, apart from its shine and usage for jewelry, the precious metal is widely seen as a safe-haven asset, meaning that it is considered a good investment during turbulent times. Gold is also widely seen as a hedge against inflation and against depreciating currencies as it doesn’t rely on any specific issuer or government.
Central banks are the biggest Gold holders. In their aim to support their currencies in turbulent times, central banks tend to diversify their reserves and buy Gold to improve the perceived strength of the economy and the currency. High Gold reserves can be a source of trust for a country’s solvency. Central banks added 1,136 tonnes of Gold worth around $70 billion to their reserves in 2022, according to data from the World Gold Council. This is the highest yearly purchase since records began. Central banks from emerging economies such as China, India and Turkey are quickly increasing their Gold reserves.
Gold has an inverse correlation with the US Dollar and US Treasuries, which are both major reserve and safe-haven assets. When the Dollar depreciates, Gold tends to rise, enabling investors and central banks to diversify their assets in turbulent times. Gold is also inversely correlated with risk assets. A rally in the stock market tends to weaken Gold price, while sell-offs in riskier markets tend to favor the precious metal.
The price can move due to a wide range of factors. Geopolitical instability or fears of a deep recession can quickly make Gold price escalate due to its safe-haven status. As a yield-less asset, Gold tends to rise with lower interest rates, while higher cost of money usually weighs down on the yellow metal. Still, most moves depend on how the US Dollar (USD) behaves as the asset is priced in dollars (XAU/USD). A strong Dollar tends to keep the price of Gold controlled, whereas a weaker Dollar is likely to push Gold prices up.
Recommended Articles


