

Silver Price Forecast: XAG/USD consolidates around $22.70 ahead of US Inflation data

Source Fxstreet
  • Silver price trades lackluster around $22.70 as the focus remains on US inflation data.
  • Soft inflation data would uplift hopes of early rate cuts by the Fed.
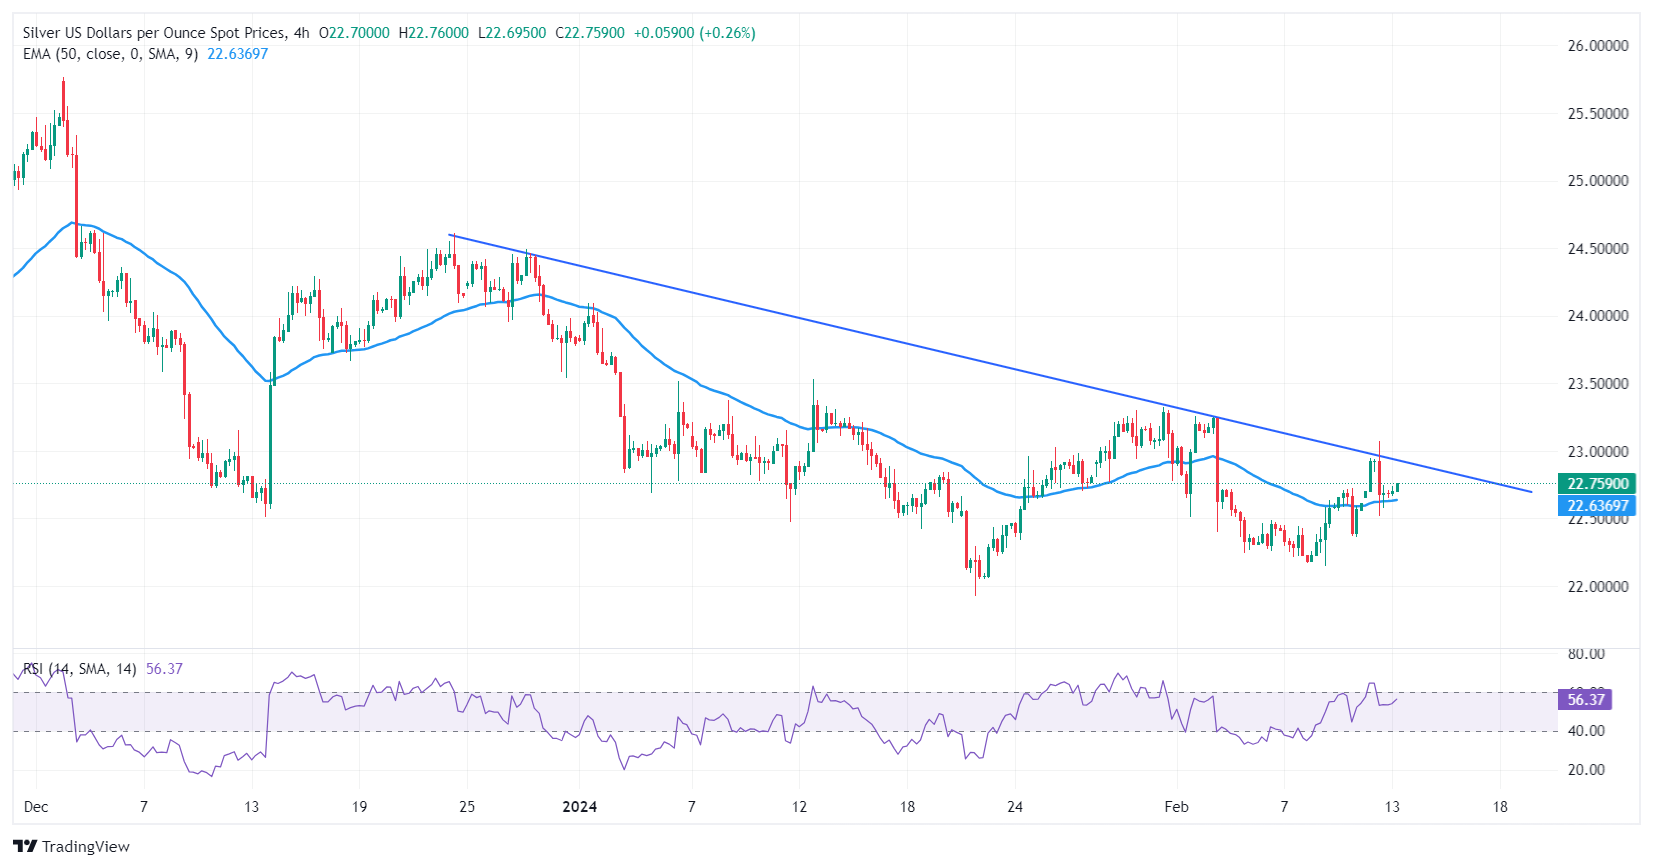
  • Silver price is consistently facing pressure from a downward-sloping trendline placed from $24.60.

Silver price (XAG/USD) trades back and forth in a narrow range around $22.70 in the late Asian session on Tuesday. The white metal struggles for a direction as investors await the United States Consumer Price Index (CPI) data for January, which will be published at 13:30 GMT.

S&P500 futures remain on the backfoot in the Tokyo session, indicating a decline in the risk appetite of the market participants. The US Dollar Index (DXY) remains positive but struggles to extend upside above the crucial resistance of 104.25. 10-year US Treasury yields rise to 4.18%.

The US inflation data is expected to impact the outlook for interest rates. As per the CME Fedwatch tool, traders bet for a rate cut by 25 basis points (bps) in May. A significant decline in the inflation data would prompt expectations of an early rate cut by the Federal Reserve (Fed).

In the last monetary policy statement, Fed Chair Jerome Powell ruled out expectations of a rate cut in March as the central bank is unconvinced about inflation declining towards the 2% target. Also, Fed policymakers have not favored aggressive rate cuts as they could increase price pressures again.

Silver technical analysis

Silver price faces pressure while extending recovery above the downward-sloping trendline plotted from December 22 high at $24.60. The asset manages to sustain above the 50-period Exponential Moving Average (EMA) at $22.63, which indicates that the near-term outlook is bullish.

The 14-period Relative Strength Index (RSI) aims to move above 60.00. A bullish momentum would get triggered if the RSI (14) manages to do so.

Silver four-hour chart
 

Disclaimer: For information purposes only. Past performance is not indicative of future results.
placeholder
Brent tests $108 as a key export pipeline stays shut — can the rally clear $110?Brent crude rose 2.55% to $106.97 and WTI 2.32% to $102.30 as a major regional export pipeline remained offline with no restart timeline. Front-month backwardation has widened to $5.53 from $3.84 a week ago, European gas is at its highest since December 2022, and one analyst sees $119.48 if talks stall.
Author  Irene Q.
Sep 14, Mon
Brent crude rose 2.55% to $106.97 and WTI 2.32% to $102.30 as a major regional export pipeline remained offline with no restart timeline. Front-month backwardation has widened to $5.53 from $3.84 a week ago, European gas is at its highest since December 2022, and one analyst sees $119.48 if talks stall.
placeholder
Fed hike odds near 90% into Wednesday's decision — how to trade the dollar, gold and the S&P 500A 0.3% monthly core CPI print has lifted the market-implied probability of a 25bp Fed hike on 16 September to roughly 86.5% ~ 90%, which would be the first increase since July 2023. Here is the decision timeline, the pricing versus the forecasts, both scenarios, and the key levels for the dollar, gold and the S&P 500.
Author  Suzie
Sep 14, Mon
A 0.3% monthly core CPI print has lifted the market-implied probability of a 25bp Fed hike on 16 September to roughly 86.5% ~ 90%, which would be the first increase since July 2023. Here is the decision timeline, the pricing versus the forecasts, both scenarios, and the key levels for the dollar, gold and the S&P 500.
placeholder
Gold falls below $4,300 as higher US yields bolster Fed rate hike betsGold price (XAU/USD) tumbles to near $4,295 during the early Asian session on Tuesday. The precious metal faces some selling pressure as rising bond yields and surging energy prices strengthen expectations that the US Federal Reserve (Fed) will raise interest rates this week. 
Author  FXStreet
Yesterday 01: 23
Gold price (XAU/USD) tumbles to near $4,295 during the early Asian session on Tuesday. The precious metal faces some selling pressure as rising bond yields and surging energy prices strengthen expectations that the US Federal Reserve (Fed) will raise interest rates this week. 
placeholder
【Daily Brief】10-year Treasury yield briefly tops 5%, S&P 500 slips to 7,602 and the dollar firms at 99.3 as the Fed's decision eve beginsThe 10-year Treasury yield touched 5.014% on Monday — its first print above 5% since October 2023 — while the S&P 500 closed 0.48% lower at 7,619.98 and the dollar index firmed to 99.3. Here is the full market wrap ahead of Wednesday's FOMC decision, the dot plot and the August retail sales report, plus today's CLARITY Act Senate vote.
Author  Irene Q.
Yesterday 08: 16
The 10-year Treasury yield touched 5.014% on Monday — its first print above 5% since October 2023 — while the S&P 500 closed 0.48% lower at 7,619.98 and the dollar index firmed to 99.3. Here is the full market wrap ahead of Wednesday's FOMC decision, the dot plot and the August retail sales report, plus today's CLARITY Act Senate vote.
placeholder
Silver breaks $64 as precious metals rebound — can gold hold the $4,280 line into the Fed decision?Silver has climbed back above $64 an ounce for the first time this week, leading a broad rebound across precious metals hours before the Federal Reserve delivers what is expected to be its first rate hike since 2023. Spot silver was last at $64.64, up 1.49% on the day, while gold reclaimed $4,300 and platinum and palladium both advanced. The question now is whether the bounce is a genuine turn — or a pause before the Fed's dot plot decides the next move.
Author  Suzie
5 hours ago
Silver has climbed back above $64 an ounce for the first time this week, leading a broad rebound across precious metals hours before the Federal Reserve delivers what is expected to be its first rate hike since 2023. Spot silver was last at $64.64, up 1.49% on the day, while gold reclaimed $4,300 and platinum and palladium both advanced. The question now is whether the bounce is a genuine turn — or a pause before the Fed's dot plot decides the next move.
Related Instrument
goTop
quote