

Crude Oil pops above $70 as traders gauge potential surprises in OPEC+ supply plans
- Oil prices tick up for a second day in a row ahead of the OPEC+ meeting on Thursday.
- US President-elect Donald Trump threatens to drag the Middle-East region into a war if hostages are not released.
- The US Dollar Index ticks up with traders looking ahead to Friday’s US Jobs Report.
Crude Oil ticks higher for a second day in a row on Wednesday, popping above the $70 round level, with traders getting nervous over geopolitical tensions and OPEC+ set to act. On the geopolitical side, President-elect Donald Trump vowed to drag the Middle East into a war if Israeli hostages are not released by Hamas by the time he takes office in January. Meanwhile, OPEC+ might be surprising friends and foes with a possible six-month delay of its production normalization output, Bloomberg reports.
The US Dollar Index (DXY) – which measures the performance of the US Dollar (USD) against a basket of currencies – is ticking up within a tight range ahead of Friday’s Nonfarm Payroll numbers. Traders appear to be sitting on their hands, keeping their powder dry to trade the last Jobs Report for 2024. Later on Thursday, Federal Reserve Chairman Jerome Powell will make an appearance, though no market moving comments are expected.
At the time of writing, Crude Oil (WTI) trades at $70.08 and Brent Crude at $73.98.
Oil news and market movers: OPEC+ might still pull that rabbit out of its hat
- Seasoned OPEC+ watcher Grant Smith warned in a recent post that OPEC+ may need to deliver a surprise plot twist at Thursday’s meeting to push Oil prices materially higher. Smith raised the possibility of a six-month pause, right out to the second half of 2025, Bloomberg reports. Market consensus is for a three-month delay.
- US President-elect Donald Trump vowed earlier this week that he would not refrain from dragging the Middle East into a war if Israeli hostages are not returned home by the time he takes office, Reuters reported.
- At 15:30 GMT, the Energy Information Administration (EIA) will release its weekly Crude stockpile change numbers. Expectations are for a drawdown of 2.06 million barrels against the draw of 1.844 million barrels last week.
- The overnight Crude stockpile change numbers from the American Petroleum Institute (API) overnight came in at a surprise build of 1.232 million barrels against the 2.06 million barrels drawdown expected and partially offsetting the big drawdown of 5.935 million barrels seen last week.
Oil Technical Analysis: OPEC+ will need to deliver
Crude Oil prices might be ticking up a nudge on the back of the comments from President-elect Donald Trump and some analysts that are starting to see signs for a possible six-month delay for OPEC+ production normalization. With these elements being priced in, the risk is that the OPEC meeting could turn in a “buy the rumour, sell the fact” moment. These drivers could quickly dissolve and see Crude prices go the other way.
On the upside, the pivotal level at $71.46 and the 100-day Simple Moving Average (SMA) at $71.79 are the two main resistances. The 200-day SMA at $76.10 is still far off, although it could be tested if tensions intensify further. In its rally towards that 200-day SMA, the pivotal level at $75.27 could still slow down any upticks.
On the other side, traders need to look towards $67.12 – a level that held the price in May and June 2023 – to find the first support. In case that breaks, the 2024 year-to-date low emerges at $64.75, followed by $64.38, the low from 2023.
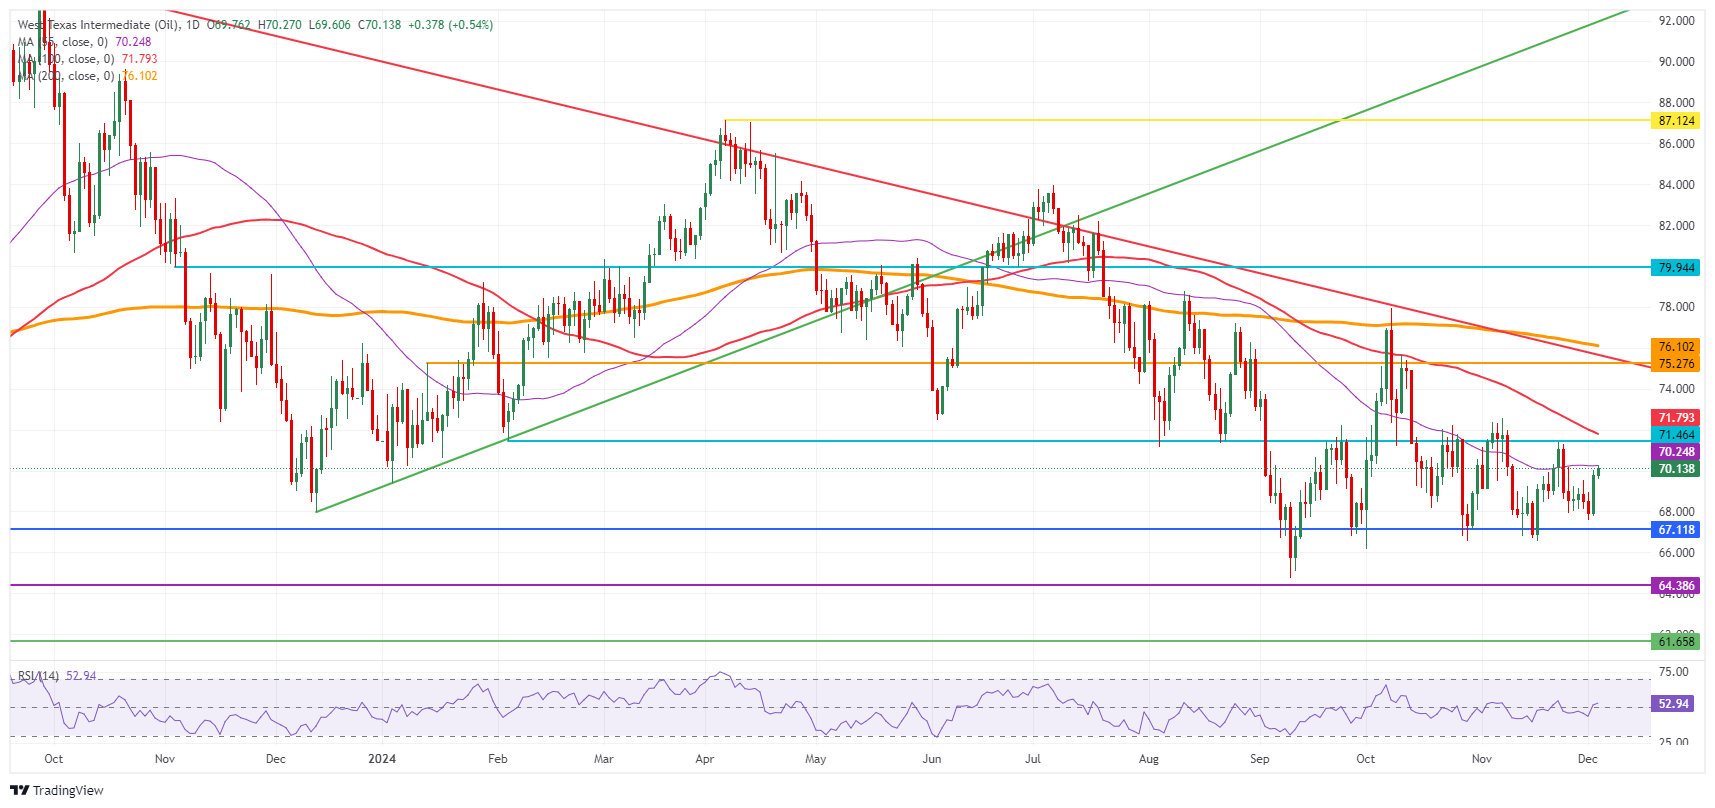
US WTI Crude Oil: Daily Chart
WTI Oil FAQs
WTI Oil is a type of Crude Oil sold on international markets. The WTI stands for West Texas Intermediate, one of three major types including Brent and Dubai Crude. WTI is also referred to as “light” and “sweet” because of its relatively low gravity and sulfur content respectively. It is considered a high quality Oil that is easily refined. It is sourced in the United States and distributed via the Cushing hub, which is considered “The Pipeline Crossroads of the World”. It is a benchmark for the Oil market and WTI price is frequently quoted in the media.
Like all assets, supply and demand are the key drivers of WTI Oil price. As such, global growth can be a driver of increased demand and vice versa for weak global growth. Political instability, wars, and sanctions can disrupt supply and impact prices. The decisions of OPEC, a group of major Oil-producing countries, is another key driver of price. The value of the US Dollar influences the price of WTI Crude Oil, since Oil is predominantly traded in US Dollars, thus a weaker US Dollar can make Oil more affordable and vice versa.
The weekly Oil inventory reports published by the American Petroleum Institute (API) and the Energy Information Agency (EIA) impact the price of WTI Oil. Changes in inventories reflect fluctuating supply and demand. If the data shows a drop in inventories it can indicate increased demand, pushing up Oil price. Higher inventories can reflect increased supply, pushing down prices. API’s report is published every Tuesday and EIA’s the day after. Their results are usually similar, falling within 1% of each other 75% of the time. The EIA data is considered more reliable, since it is a government agency.
OPEC (Organization of the Petroleum Exporting Countries) is a group of 12 Oil-producing nations who collectively decide production quotas for member countries at twice-yearly meetings. Their decisions often impact WTI Oil prices. When OPEC decides to lower quotas, it can tighten supply, pushing up Oil prices. When OPEC increases production, it has the opposite effect. OPEC+ refers to an expanded group that includes ten extra non-OPEC members, the most notable of which is Russia.
Recommended Articles


