

Silver Price Forecast: XAG/USD consolidates around mid-$30.00s, not out of the woods yet
- Silver oscillates in a range and remains close to a multi-week low touched on Tuesday.
- The technical setup favors bearish traders and supports prospects for further losses.
- Bears still need to wait for a sustained break below $30.00 before placing fresh bets.
Silver (XAG/USD) lacks any firm intraday direction on Thursday and oscillates in a narrow trading band around mid-$30.00s through the first half of the European session. The white metal remains within the striking distance of a nearly three-week low touched on Tuesday and seems vulnerable to prolonging its rejection slide from the $33.0 neighborhood, or the highest level since December 2012 set last week.
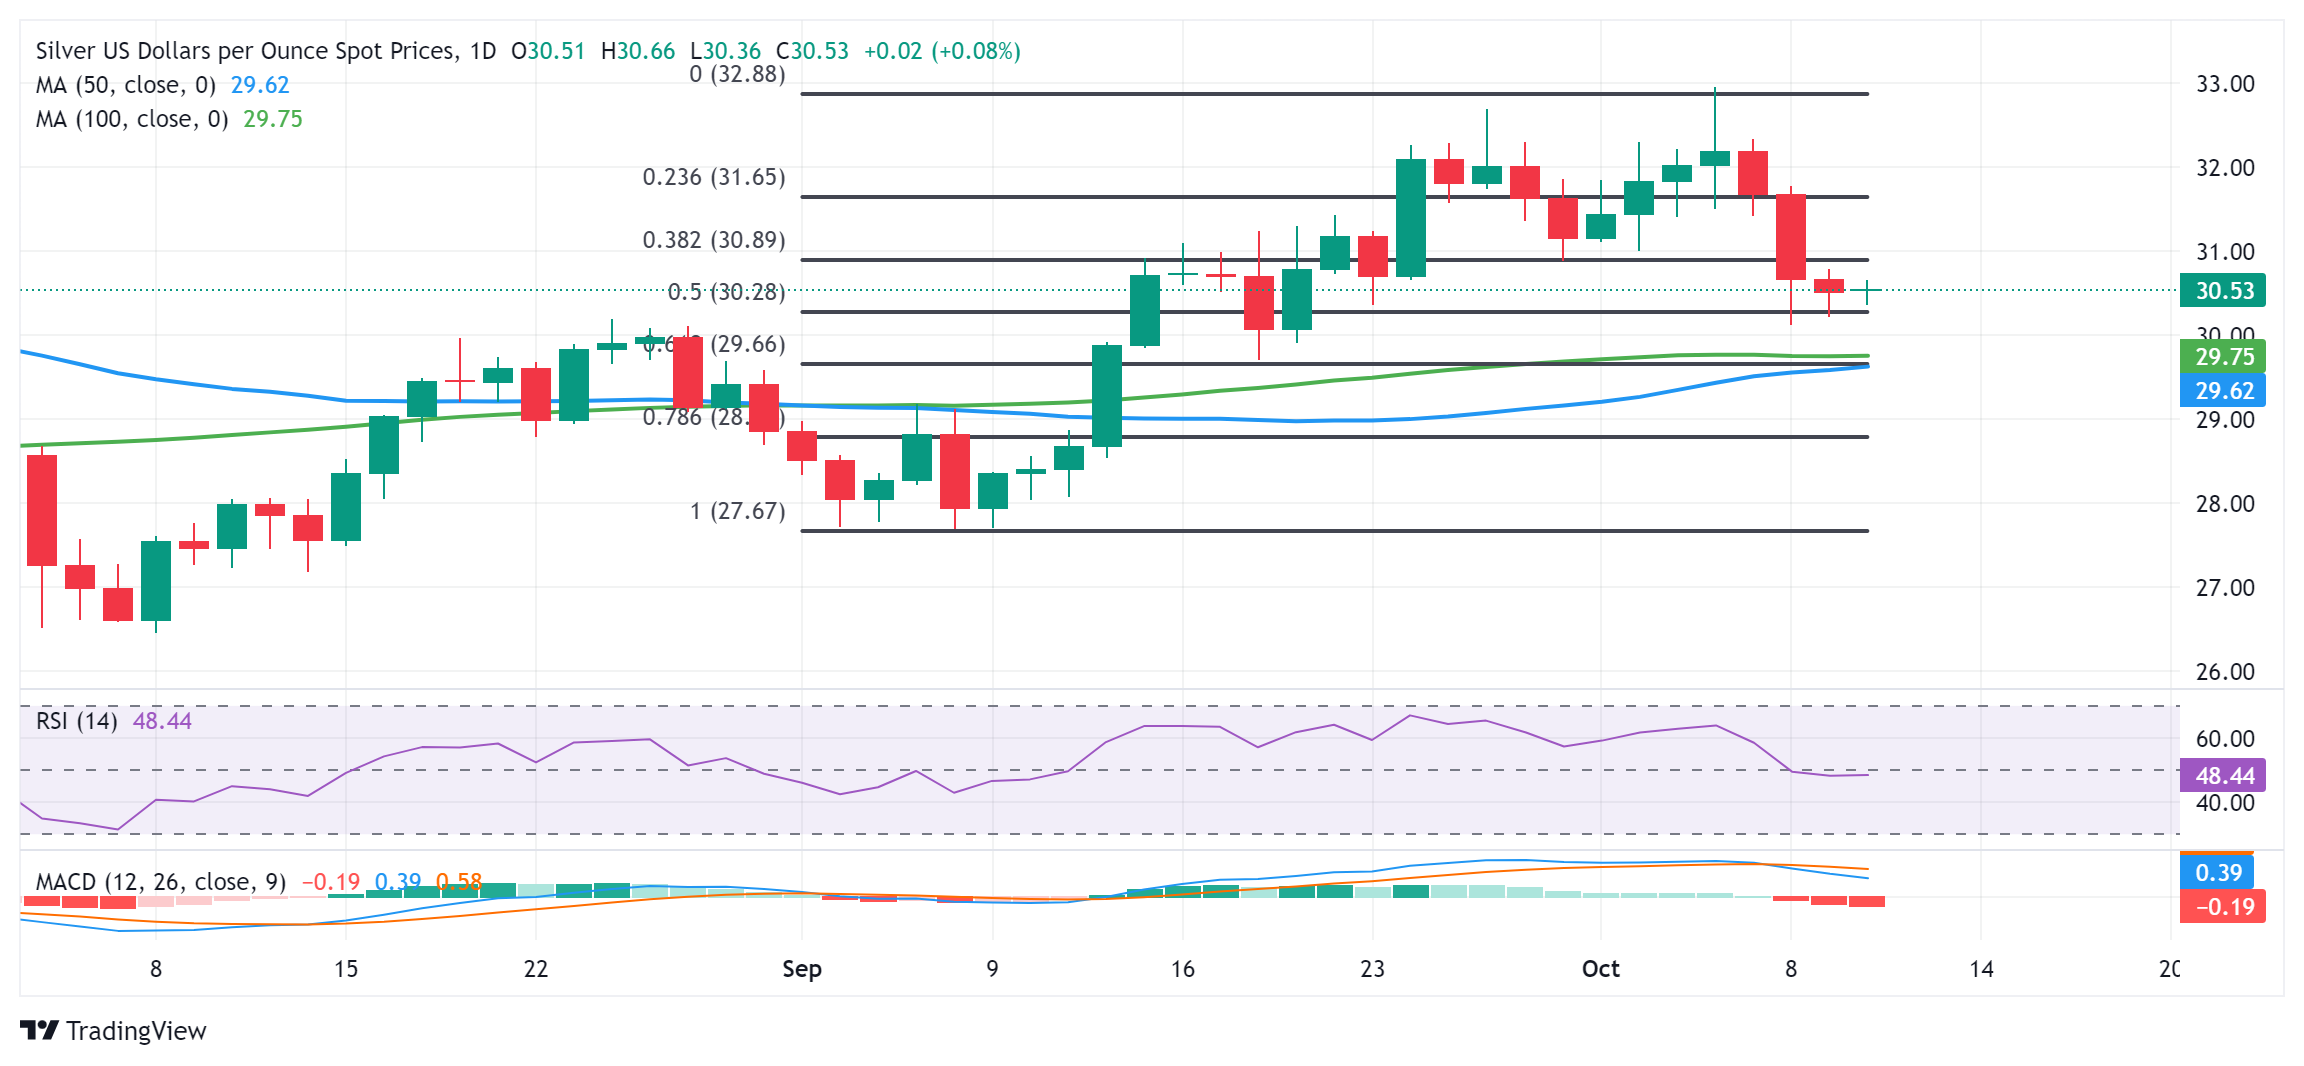
The recent repeated failures to capitalize on momentum beyond the $32.00 mark constitute the formation of a bearish multiple-tops on the daily chart. Moreover, oscillators on the daily chart have started gaining negative traction and add credence to the near-term bearish outlook for the XAG/USD. That said, it will still be prudent to wait for a sustained break and acceptance below the $30.00 psychological mark before positioning for any further depreciating move.
The subsequent downfall could drag the XAG/USD to the $29.75-$29.60 confluence support – comprising the 100-day Simple Moving Average (SMA) and the 50-day SMA. A convincing break below the latter should pave the way for a fall towards the $29.00 mark en route to the next relevant support near the $28.60-$28.50 zone.
On the flip side, any attempted positive move now seems to confront resistance near the $31.00 horizontal support breakpoint. Some follow-through buying, however, might trigger a short-covering rally and allow the XAG/USD to reclaim the $32.00 mark, with some intermediate hurdle near the $31.55 area and the $31.75-$31.80 region. The momentum could extend further towards the $32.25 supply zone en route to the multi-year peak, just ahead of the $33.00 round figure.
Silver daily chart
Silver FAQs
Silver is a precious metal highly traded among investors. It has been historically used as a store of value and a medium of exchange. Although less popular than Gold, traders may turn to Silver to diversify their investment portfolio, for its intrinsic value or as a potential hedge during high-inflation periods. Investors can buy physical Silver, in coins or in bars, or trade it through vehicles such as Exchange Traded Funds, which track its price on international markets.
Silver prices can move due to a wide range of factors. Geopolitical instability or fears of a deep recession can make Silver price escalate due to its safe-haven status, although to a lesser extent than Gold's. As a yieldless asset, Silver tends to rise with lower interest rates. Its moves also depend on how the US Dollar (USD) behaves as the asset is priced in dollars (XAG/USD). A strong Dollar tends to keep the price of Silver at bay, whereas a weaker Dollar is likely to propel prices up. Other factors such as investment demand, mining supply – Silver is much more abundant than Gold – and recycling rates can also affect prices.
Silver is widely used in industry, particularly in sectors such as electronics or solar energy, as it has one of the highest electric conductivity of all metals – more than Copper and Gold. A surge in demand can increase prices, while a decline tends to lower them. Dynamics in the US, Chinese and Indian economies can also contribute to price swings: for the US and particularly China, their big industrial sectors use Silver in various processes; in India, consumers’ demand for the precious metal for jewellery also plays a key role in setting prices.
Silver prices tend to follow Gold's moves. When Gold prices rise, Silver typically follows suit, as their status as safe-haven assets is similar. The Gold/Silver ratio, which shows the number of ounces of Silver needed to equal the value of one ounce of Gold, may help to determine the relative valuation between both metals. Some investors may consider a high ratio as an indicator that Silver is undervalued, or Gold is overvalued. On the contrary, a low ratio might suggest that Gold is undervalued relative to Silver.
Recommended Articles


