

Silver Price Forecast: XAG/USD creeps lower and stays above $30.00
- Silver remains above $30.12 despite losses of over 0.30%, with downside risks looming after Tuesday’s sharp 3.28% drop.
- Momentum favors sellers, with the next key support levels at $30.12 and the psychological $30.00 mark.
- Buyers need to reclaim $30.50 to target $31.00, with a break above $31.77 necessary to shift the bias back to the upside.
Silver consolidated at around the weekly lows on Wednesday, posting losses of over 0.30%, but it remains above the October 8 daily low of $30.12 late in the North American session. At the time of writing, the XAG/USD trades at $30.61, sponsored by higher US Treasury bond yields following the release of the latest FOMC meeting minutes.
The minutes showed some officials were looking for a 25 basis points rate cut at the September meeting. According to the minutes, officials agreed that the larger cut approved at the meeting shouldn’t be a sign of concern over the economic outlook or viewed as a signal that the Fed was prepared to rapidly lower interest rates.
XAG/USD Price Forecast: Technical outlook
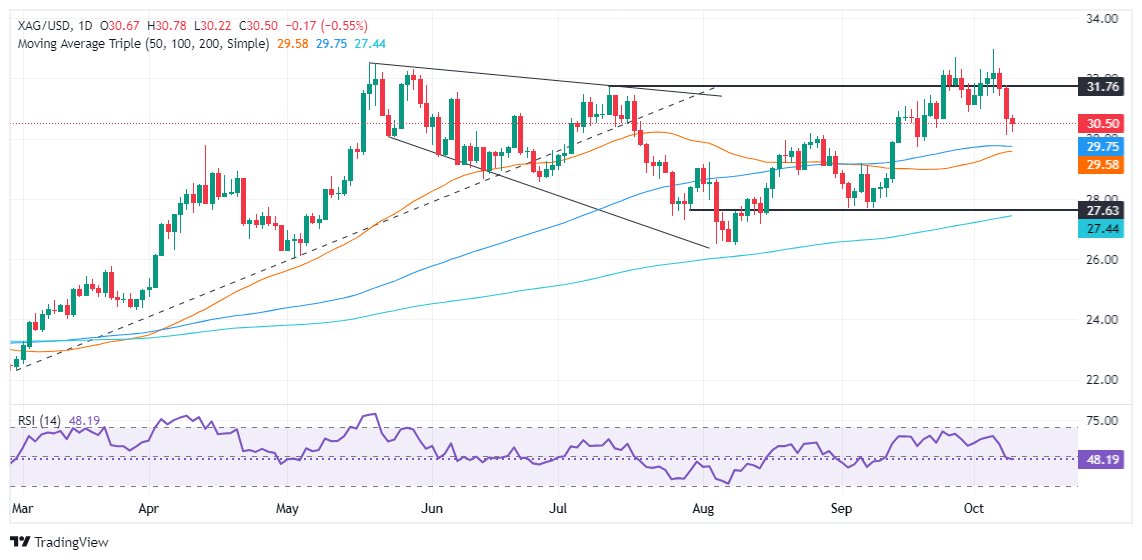
Silver price stopped its downfall following Tuesday’s over 3.28% loss. Although this could open the door for some consolidation, downside risks remain.
Momentum is still favoring sellers, according to the Relative Strength Index (RSI). With that said, the path of least resistance in the short term is tilted to the downside.
The XAG/USD's next support will be $30.12. Once broken, sellers could challenge the psychological figure of $30.00. If surpassed, the confluence of the 100 and 50-day moving averages (DMAs) would be up next at $29.73 and $29.53, respectively.
Conversely, if XAG/USD buyers move in and push prices above $30.50, they could lift the grey’s metal price toward $31.00. However, to shift the bias to upward, they must clear the $31.77 October 8 peak.
XAG/USD Price Action – Daily Chart
Silver FAQs
Silver is a precious metal highly traded among investors. It has been historically used as a store of value and a medium of exchange. Although less popular than Gold, traders may turn to Silver to diversify their investment portfolio, for its intrinsic value or as a potential hedge during high-inflation periods. Investors can buy physical Silver, in coins or in bars, or trade it through vehicles such as Exchange Traded Funds, which track its price on international markets.
Silver prices can move due to a wide range of factors. Geopolitical instability or fears of a deep recession can make Silver price escalate due to its safe-haven status, although to a lesser extent than Gold's. As a yieldless asset, Silver tends to rise with lower interest rates. Its moves also depend on how the US Dollar (USD) behaves as the asset is priced in dollars (XAG/USD). A strong Dollar tends to keep the price of Silver at bay, whereas a weaker Dollar is likely to propel prices up. Other factors such as investment demand, mining supply – Silver is much more abundant than Gold – and recycling rates can also affect prices.
Silver is widely used in industry, particularly in sectors such as electronics or solar energy, as it has one of the highest electric conductivity of all metals – more than Copper and Gold. A surge in demand can increase prices, while a decline tends to lower them. Dynamics in the US, Chinese and Indian economies can also contribute to price swings: for the US and particularly China, their big industrial sectors use Silver in various processes; in India, consumers’ demand for the precious metal for jewellery also plays a key role in setting prices.
Silver prices tend to follow Gold's moves. When Gold prices rise, Silver typically follows suit, as their status as safe-haven assets is similar. The Gold/Silver ratio, which shows the number of ounces of Silver needed to equal the value of one ounce of Gold, may help to determine the relative valuation between both metals. Some investors may consider a high ratio as an indicator that Silver is undervalued, or Gold is overvalued. On the contrary, a low ratio might suggest that Gold is undervalued relative to Silver.
Recommended Articles


