

Silver Price Forecast: XAG/USD soars above $31 after Fed’s bumper rate cut decision
- Silver price rallies above $31.00 in the aftermath of the Fed’s policy announcement.
- The Fed cut interest rates by 50 bps to 4.75%-5.00%.
- Fed’s bumper interest rate cut signals that inflation is on track to return to the bank’s target of 2%.
Silver price (XAG/USD) delivers a sharp rally above the crucial resistance of $31.00 in Thursday’s European session. The white metal strengthens as the US Dollar (USD) surrenders its early gains and declines. The US Dollar weakens as the dust settles after the Federal Reserve’s (Fed) monetary policy decision in which the central bank announced its first ever interest rate cut in more than four years.
Historically, lower interest rates by the Fed bode well for non-yielding assets, such as Silver, as they reduce the opportunity cost of holding an investment in them.
The US Dollar Index (DXY), which tracks the Greenback’s value against six major currencies, falls to near 100.60, following the Fed 50-basis points (bps) interest rate cut to 4.75%-5.00%. The Fed was widely anticipated to cut interest rates but traders were divided over potential rate cut size. A bumper interest rate cut by the Fed gives a clear indication that price pressures are on track to return to the bank’s target of 2%.
For the interest rate guidance, policymakers see the federal fund rate heading to 4.4% by year-end, which suggests that there will be at least 25 bps more decline in interest rates. On the contrary, the CME FedWatch tool shows that the central bank will cut 75 bps in the remaining monetary policies this year.
Silver technical analysis
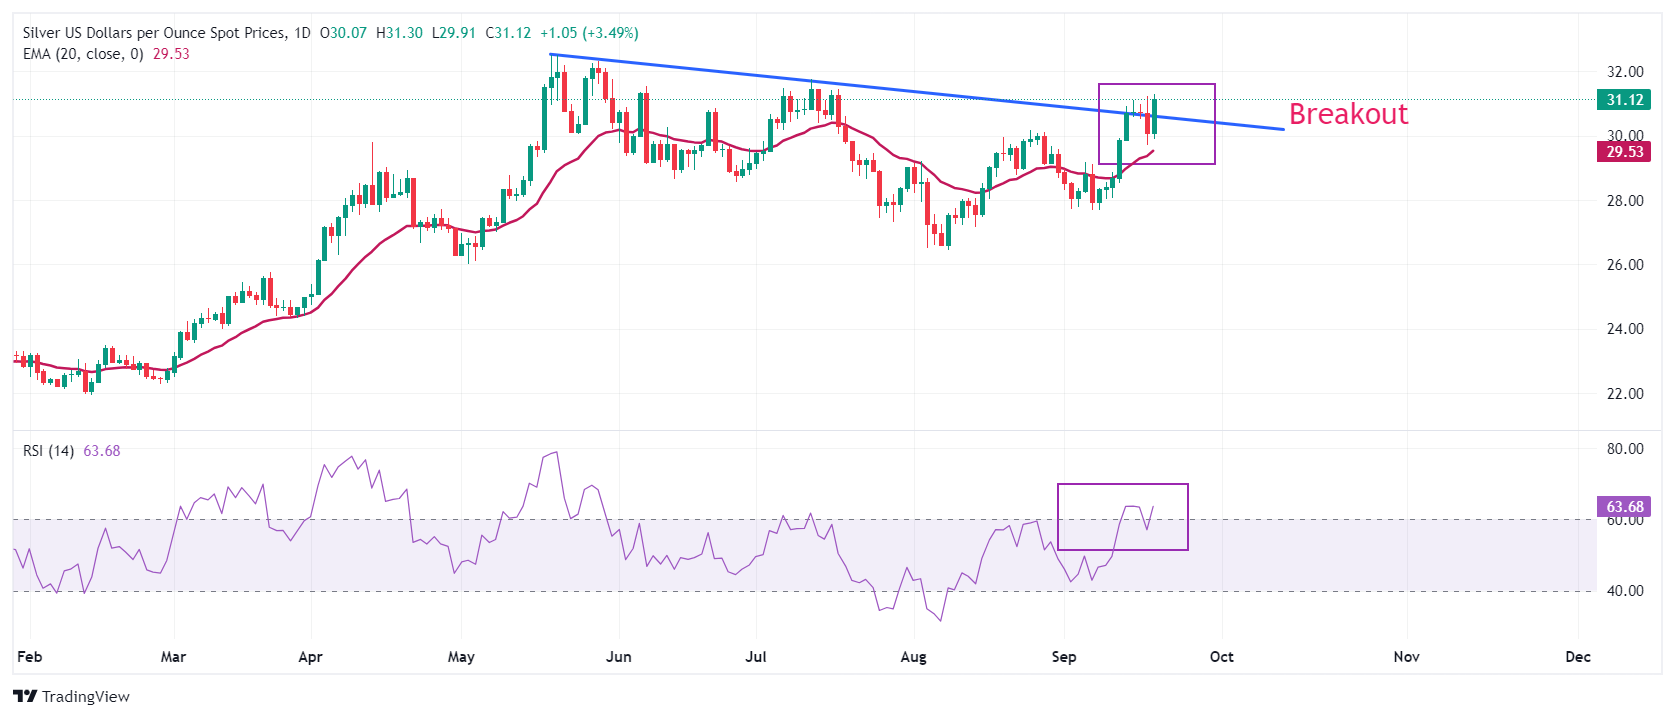
Silver price strengthens as it has delivered a breakout of the downward-sloping trendline plotted from May 20 high of $32.50. The asset is expected to extend its upside towards the previous high of $32.50. Upward-sloping 20-day Exponential Moving Average (EMA) near $29.50 suggests that the near-term outlook is upbeat.
The 14-day Relative Strength Index (RSI) stands above 60.00. A fresh round of bullish momentum could occur if the oscillator sustains around this level.
Silver daily chart
Silver FAQs
Silver is a precious metal highly traded among investors. It has been historically used as a store of value and a medium of exchange. Although less popular than Gold, traders may turn to Silver to diversify their investment portfolio, for its intrinsic value or as a potential hedge during high-inflation periods. Investors can buy physical Silver, in coins or in bars, or trade it through vehicles such as Exchange Traded Funds, which track its price on international markets.
Silver prices can move due to a wide range of factors. Geopolitical instability or fears of a deep recession can make Silver price escalate due to its safe-haven status, although to a lesser extent than Gold's. As a yieldless asset, Silver tends to rise with lower interest rates. Its moves also depend on how the US Dollar (USD) behaves as the asset is priced in dollars (XAG/USD). A strong Dollar tends to keep the price of Silver at bay, whereas a weaker Dollar is likely to propel prices up. Other factors such as investment demand, mining supply – Silver is much more abundant than Gold – and recycling rates can also affect prices.
Silver is widely used in industry, particularly in sectors such as electronics or solar energy, as it has one of the highest electric conductivity of all metals – more than Copper and Gold. A surge in demand can increase prices, while a decline tends to lower them. Dynamics in the US, Chinese and Indian economies can also contribute to price swings: for the US and particularly China, their big industrial sectors use Silver in various processes; in India, consumers’ demand for the precious metal for jewellery also plays a key role in setting prices.
Silver prices tend to follow Gold's moves. When Gold prices rise, Silver typically follows suit, as their status as safe-haven assets is similar. The Gold/Silver ratio, which shows the number of ounces of Silver needed to equal the value of one ounce of Gold, may help to determine the relative valuation between both metals. Some investors may consider a high ratio as an indicator that Silver is undervalued, or Gold is overvalued. On the contrary, a low ratio might suggest that Gold is undervalued relative to Silver.
Recommended Articles


