Silver Price Prediction: Reaches top of long-term range

Source Fxstreet
  • Silver has reached the top of a long-term range. 
  • It is at risk of pulling back although price action remains quite bullish. 

Silver (XAG/USD) has reached the top of a broad range that stretches from the $26s to the $30s. 

It has just tested firm resistance from the top of the range and is at risk of pulling back.  

Silver 4-hour Chart 

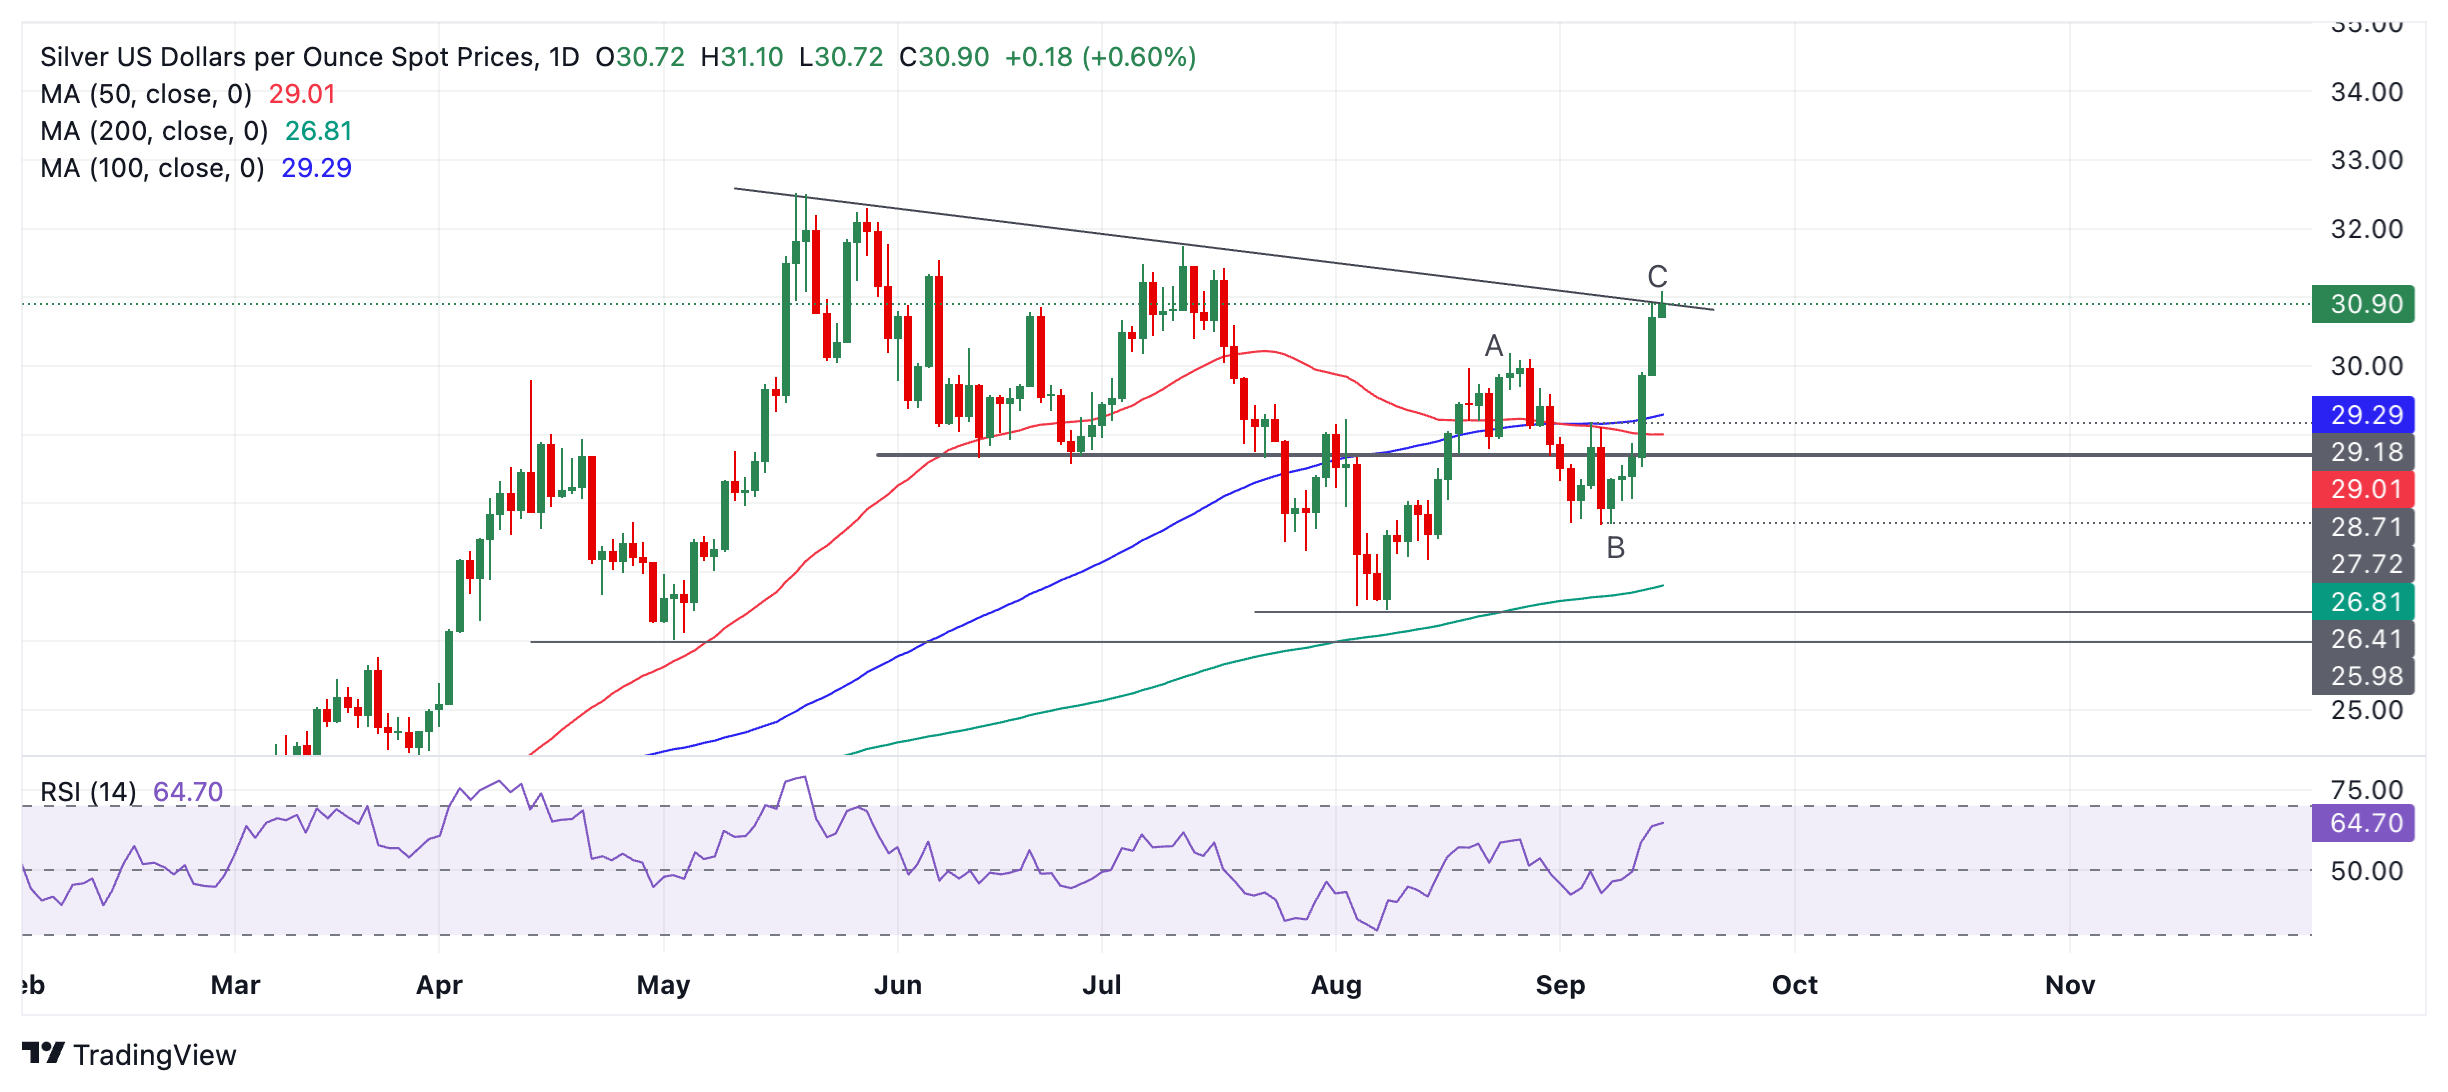
Silver has formed a Measured Move price pattern since the August 8 low. Such patterns consist of three waves in a zig-zag pattern, with waves A and C usually of a similar length. In the case of Silver, A and C are of a similar length, adding credence to the theory price may correct back. 

The Relative Strength Index (RSI) momentum indicator is rising in line with price, however, which is mildly supportive of the bullish short-term trend. Given it is a principle of technical analysis that “the trend is your friend” there is a chance Silver could bypass resistance from the top of the range and continue higher. A decisive break above the range ceiling would confirm such a breakout and lead to probable move up to $32.94, the 0.618 Fibonacci ratio of C leg extended higher. 

A decisive break would be one accompanied by a long green candlestick that broke clearly above the level and closed near its high, or three candlesticks in a row that broke above the level.

Currently there are no signs from price action that Silver is about to correct back – only the resistance line drawn on the chart. A reversal candlestick pattern, however, such as a Shooting Star or Hanging Man, for example, would substantially increase the odds of a pull back evolving. Such a move would probably find firm support at the $30.00 level, the top of wave A. 


Disclaimer: For information purposes only. Past performance is not indicative of future results.
placeholder
Bitcoin Price Forecast: BTC battles at key technical zone amid mixed flow signalsBitcoin (BTC) steadies around the key technical support on Tuesday after its recent correction. The Crypto King’s next directional move could hinge on this key technical zone.
Author  FXStreet
11 hours ago
Bitcoin (BTC) steadies around the key technical support on Tuesday after its recent correction. The Crypto King’s next directional move could hinge on this key technical zone.
placeholder
WTI declines below $102.00 after Trump says he called off Iran attacksWest Texas Intermediate (WTI), the US crude oil benchmark, is trading around $101.85 during the early Asian trading hours on Tuesday. The WTI price declines after US President Donald Trump said he was holding off a military attack on Iran planned for Tuesday at the request of Gulf states.
Author  FXStreet
20 hours ago
West Texas Intermediate (WTI), the US crude oil benchmark, is trading around $101.85 during the early Asian trading hours on Tuesday. The WTI price declines after US President Donald Trump said he was holding off a military attack on Iran planned for Tuesday at the request of Gulf states.
placeholder
Iran Situation Rekindles Threat of War. Bitcoin Price Decline Accelerates, $75,000 Geopolitical Defense Line Faces TestU.S.-Israel discussions on resuming strikes against Iran trigger an accelerated Bitcoin price pullback; future gains depend on whether the $75,000 support level holds.On May 18, the poten
Author  TradingKey
Yesterday 09: 03
U.S.-Israel discussions on resuming strikes against Iran trigger an accelerated Bitcoin price pullback; future gains depend on whether the $75,000 support level holds.On May 18, the poten
placeholder
Euro softens to near 1.1600 on US–Iran tensions The EUR/USD pair trades in negative territory around 1.1615 during the early Asian session on Monday. The Euro (EUR) extends the decline as the prolonged US-Iran conflict weighs on the riskier assets.
Author  FXStreet
Yesterday 01: 34
The EUR/USD pair trades in negative territory around 1.1615 during the early Asian session on Monday. The Euro (EUR) extends the decline as the prolonged US-Iran conflict weighs on the riskier assets.
placeholder
Financial Markets 2026: Volatility Catalysts in Gold, Silver, Oil, and Blue-Chip Stocks—A CFD Trader's OutlookGet a comprehensive financial market 2026 outlook exploring key economic drivers, volatility catalysts in gold, oil and stocks, and what the evolving economic outlook means for cfd trading strategies and risk management on global markets.
Author  Rachel Weiss
May 15, Fri
Get a comprehensive financial market 2026 outlook exploring key economic drivers, volatility catalysts in gold, oil and stocks, and what the evolving economic outlook means for cfd trading strategies and risk management on global markets.
goTop
quote