


Gold price surges to record highs above $2,550 as Fed rate cut expectations mount
- Gold hits new all-time high as US jobless claims and producer inflation data reinforce a likely Fed rate cut.
- US Dollar Index (DXY) falls 0.29%, while US Treasury yields rise, with the 10-year T-note at 3.689%.
- CME FedWatch Tool shows an 85% chance of a 25 bps Fed rate cut, further boosting Gold’s appeal in a low-rate environment.
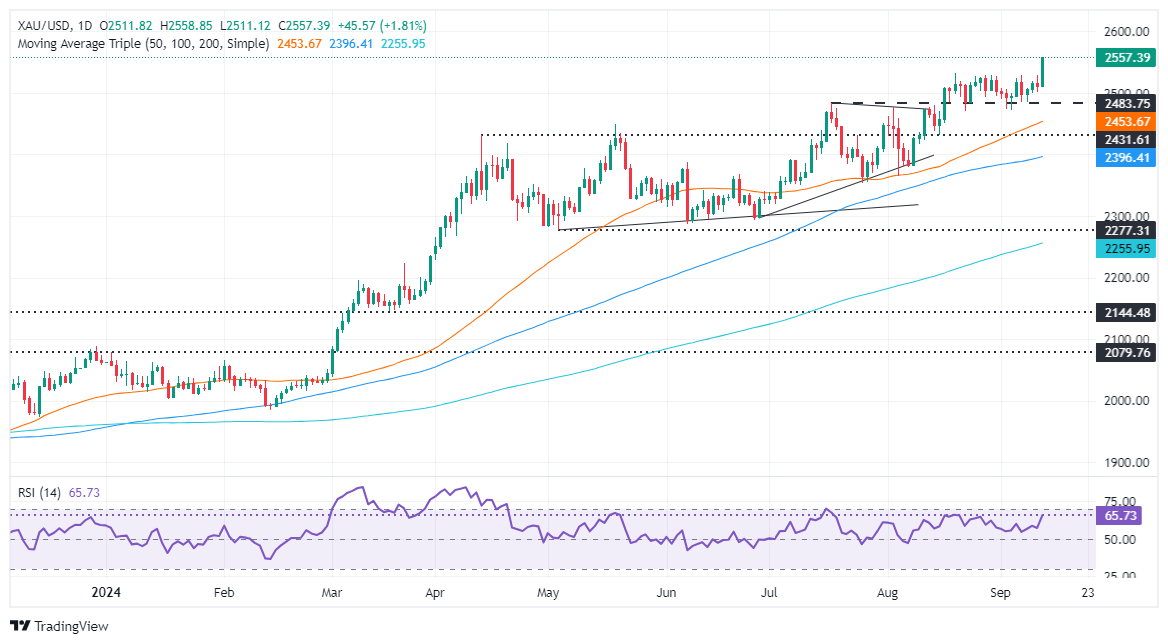
Gold price rallied to new all-time highs above $2,550 after US data reinforced that the US Federal Reserve (Fed) would likely lower interest rates next week. At the time of writing, the XAU/USD trades at $2,552 after bouncing off a daily low of $2,511 to gain 1.67%.
Sentiment is upbeat as Wall Street posts gains. The US Labor Department revealed that Initial Jobless Claims for the week ending September 7 rose as expected, increasing above the previous week’s reading. Other data showed that prices paid by producers, known as factory inflation, rose above estimates due to higher costs in services.
After the data, the US Dollar Index (DXY), which tracks the buck’s performance against its peers, dived to a daily low of 101.44 and lost 0.29%. On the contrary, US Treasury yields rose, with the 10-year T-note gaining three and a half basis points (bps) and sitting at 3.689%.
A source quoted by Reuters noted, “We are headed towards a lower interest rate environment, so gold is becoming a lot more attractive... I think we could potentially have a lot more frequent cuts as opposed to a bigger magnitude.”
The CME FedWatch Tool shows that market participants are pricing an 85% chance of the Fed lowering rates by 25 basis points and a 15% odds of a 50 bps cut.
Besides US data fueling expectations for the Fed’s first cut, the European Central Bank (ECB) lowering rates by a quarter of a percentage point sponsored a rally on the EUR/USD and weighed on the Greenback’s value.
Bullion traders will examine the Consumer Sentiment survey released by the University of Michigan on Friday.
Daily digest market moves: Gold price surges post US jobs and inflation data
- Bureau of Labor Statistics (BLS) revealed that Initial Jobless Claims for the week ending September 7 rose 230K as expected, up from 228K on the previous number.
- August's Producer Price Index (PPI) rose by 1.7% YoY, slightly below estimates of 1.8%, while core PPI increased from 2.3% to 2.4%, below expectations of 2.5%.
- Monthly, headline and core PPI increased compared to the previous month's reading. Headline PPI expanded by 0.2%, exceeding the 0.1% forecast, and core PPI rose by 0.3%, up from 0.2%.
- Today’s data and Wednesday’s Consumer Price Index (CPI) have cemented a 25 bps rate cut, sponsoring Gold’s rally ahead of the Fed’s meeting.
- Data from the Chicago Board of Trade suggests the Fed will cut at least 98 basis points this year, down from 108 a day ago, according to the fed funds rate futures contract for December 2024.
Technical outlook: Gold price clings to $2,500 despite posting losses
Gold prices skyrocketed to new all-time highs (ATH), clearing on its way north the previous ATH at $2,531 and the $2,550 figure. Momentum accelerated to the upside despite the inverse correlation between bullion prices and US Treasury yields breaking during the day.
If XAU/USD extends its uptrend, the next resistance would be the psychological key levels like the $2,575 mark, followed by the $2,600 figure.
For a pullback, sellers must clear $2,550, followed by the August 20 high at $2,531 before aiming toward $2,500. On further weakness, the next support would be the August 22 low at $2,470, followed by the May 20 peak at $2,450.
Gold FAQs
Gold has played a key role in human’s history as it has been widely used as a store of value and medium of exchange. Currently, apart from its shine and usage for jewelry, the precious metal is widely seen as a safe-haven asset, meaning that it is considered a good investment during turbulent times. Gold is also widely seen as a hedge against inflation and against depreciating currencies as it doesn’t rely on any specific issuer or government.
Central banks are the biggest Gold holders. In their aim to support their currencies in turbulent times, central banks tend to diversify their reserves and buy Gold to improve the perceived strength of the economy and the currency. High Gold reserves can be a source of trust for a country’s solvency. Central banks added 1,136 tonnes of Gold worth around $70 billion to their reserves in 2022, according to data from the World Gold Council. This is the highest yearly purchase since records began. Central banks from emerging economies such as China, India and Turkey are quickly increasing their Gold reserves.
Gold has an inverse correlation with the US Dollar and US Treasuries, which are both major reserve and safe-haven assets. When the Dollar depreciates, Gold tends to rise, enabling investors and central banks to diversify their assets in turbulent times. Gold is also inversely correlated with risk assets. A rally in the stock market tends to weaken Gold price, while sell-offs in riskier markets tend to favor the precious metal.
The price can move due to a wide range of factors. Geopolitical instability or fears of a deep recession can quickly make Gold price escalate due to its safe-haven status. As a yield-less asset, Gold tends to rise with lower interest rates, while higher cost of money usually weighs down on the yellow metal. Still, most moves depend on how the US Dollar (USD) behaves as the asset is priced in dollars (XAU/USD). A strong Dollar tends to keep the price of Gold controlled, whereas a weaker Dollar is likely to push Gold prices up.
Recommended Articles


