

Silver Price Forecast: XAG/USD plummets over 3% below $28.00

Source Fxstreet
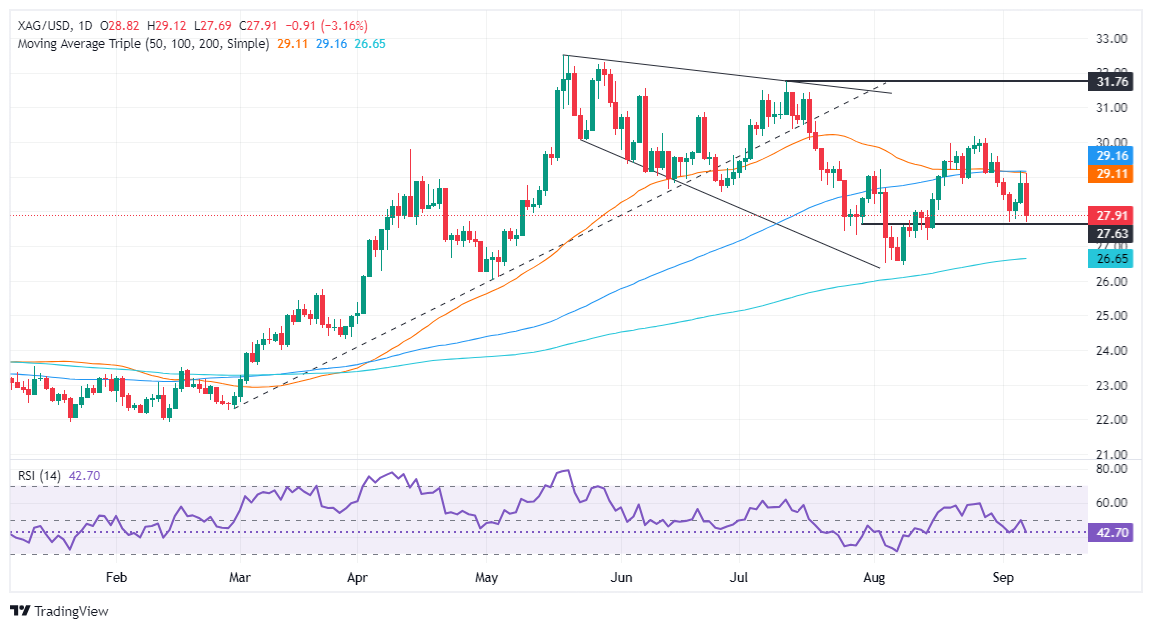
  • Silver retreats from $29.11 after failing to clear key resistance at confluence of the 50 and 100-day moving averages.
  • RSI signals strong bearish momentum, with next support at $27.18, followed by $27.00 and the 200-DMA at $26.62.
  • A rebound above $29.15 could lift Silver toward the key psychological level of $30.00.

The Silver price plunged late in the North American session, down over 3%, and traded at $27.89 after reaching a high of $29.11. Market sentiment turned risk-averse to precious metals, while the Greenback gathered some traction amid falling US yields.

XAG/USD Price Forecast: Technical outlook

Silver prices retreated after testing the confluence of the 50 and 100-day moving averages (DMAs) at around $29.00-$29.15, which exacerbated the precious metal fall of over USD 1.00.

Sellers gathered ground as momentum turned bearish. The Relative Strength Index (RSI) is on a steepest fall, signaling that the downtrend is strong.

Once XAG/USD dropped below $28.00, the next support would be the August 14 swing low of $27.18. If surpassed, bears could drive the spot prices to $27.00 before challenging the 200-DMA at $26.62/

Conversely, if XAG/USD buyers lift prices above $29.15, the precious metal could remain bid. Up next would be the $30.00 figure.

XAG/USD Price Action – Daily Chart
Silver FAQs

Silver is a precious metal highly traded among investors. It has been historically used as a store of value and a medium of exchange. Although less popular than Gold, traders may turn to Silver to diversify their investment portfolio, for its intrinsic value or as a potential hedge during high-inflation periods. Investors can buy physical Silver, in coins or in bars, or trade it through vehicles such as Exchange Traded Funds, which track its price on international markets.

Silver prices can move due to a wide range of factors. Geopolitical instability or fears of a deep recession can make Silver price escalate due to its safe-haven status, although to a lesser extent than Gold's. As a yieldless asset, Silver tends to rise with lower interest rates. Its moves also depend on how the US Dollar (USD) behaves as the asset is priced in dollars (XAG/USD). A strong Dollar tends to keep the price of Silver at bay, whereas a weaker Dollar is likely to propel prices up. Other factors such as investment demand, mining supply – Silver is much more abundant than Gold – and recycling rates can also affect prices.

Silver is widely used in industry, particularly in sectors such as electronics or solar energy, as it has one of the highest electric conductivity of all metals – more than Copper and Gold. A surge in demand can increase prices, while a decline tends to lower them. Dynamics in the US, Chinese and Indian economies can also contribute to price swings: for the US and particularly China, their big industrial sectors use Silver in various processes; in India, consumers’ demand for the precious metal for jewellery also plays a key role in setting prices.

Silver prices tend to follow Gold's moves. When Gold prices rise, Silver typically follows suit, as their status as safe-haven assets is similar. The Gold/Silver ratio, which shows the number of ounces of Silver needed to equal the value of one ounce of Gold, may help to determine the relative valuation between both metals. Some investors may consider a high ratio as an indicator that Silver is undervalued, or Gold is overvalued. On the contrary, a low ratio might suggest that Gold is undervalued relative to Silver.


Disclaimer: For information purposes only. Past performance is not indicative of future results.
placeholder
Gold Price Analysis Today | Forex Gold Analysis | XAU/USD Analysis - November 9, 2026Get the latest gold price analysis, forex gold insights, and XAU/USD analysis for November 9, 2026. Read on for the details.
Author  Mitrade
Yesterday 02: 20
Get the latest gold price analysis, forex gold insights, and XAU/USD analysis for November 9, 2026. Read on for the details.
placeholder
Bitcoin ETFs sold $1.28 billion in a week — and BTC is still above 75,000US spot Bitcoin ETFs logged $1.28 billion of net outflows in the week to Nov 6, the largest since late June, with BlackRock's IBIT accounting for $1.21 billion. Yet BTC only fell from $80,405 to $74,940, a 6.8% move. The gap between the fund flow and the price is the story: leveraged longs were flushed, but spot holders did not follow the ETFs out — and $75,000 is the line that decides whether that reading holds.
Author  Suzie
23 hours ago
US spot Bitcoin ETFs logged $1.28 billion of net outflows in the week to Nov 6, the largest since late June, with BlackRock's IBIT accounting for $1.21 billion. Yet BTC only fell from $80,405 to $74,940, a 6.8% move. The gap between the fund flow and the price is the story: leveraged longs were flushed, but spot holders did not follow the ETFs out — and $75,000 is the line that decides whether that reading holds.
placeholder
Weekly Report: Gold up 4.5%, Brent down 16.4% — three commodity regimes just resetGold rose 4.51% to $4,074.90 while Brent fell 16.42% to $98.32 in the same five sessions — two inflation hedges, opposite answers. Around them, the gold-silver ratio sits at 78.7 and copper fell 3.72%. Three regime signals, two of them close to flipping, define what commodity traders must re-price before Tuesday's CPI.
Author  Irene Q.
23 hours ago
Gold rose 4.51% to $4,074.90 while Brent fell 16.42% to $98.32 in the same five sessions — two inflation hedges, opposite answers. Around them, the gold-silver ratio sits at 78.7 and copper fell 3.72%. Three regime signals, two of them close to flipping, define what commodity traders must re-price before Tuesday's CPI.
placeholder
The CPI that has no year-over-year number is the one that decides DecemberOctober CPI lands on Nov 10 at 13:30 GMT, and it will be published without a year-over-year figure: BLS never collected October 2025 prices during the federal shutdown. Consensus is +0.3% headline and +0.2% core month-on-month, against +0.6% and +0.3% in September. With December hike odds at 77%, the month-on-month print is now the whole story, and $4,197–4,202 on gold and 4.86% on the 10-year are the levels that price it.
Author  Irene Q.
23 hours ago
October CPI lands on Nov 10 at 13:30 GMT, and it will be published without a year-over-year figure: BLS never collected October 2025 prices during the federal shutdown. Consensus is +0.3% headline and +0.2% core month-on-month, against +0.6% and +0.3% in September. With December hike odds at 77%, the month-on-month print is now the whole story, and $4,197–4,202 on gold and 4.86% on the 10-year are the levels that price it.
placeholder
US October CPI Preview: Inflation Growth May Slow, How Will US Stocks, Dollar and Gold React? On Tuesday (Nov. 10) Eastern Time, the U.S. will release the October Consumer Price Index (CPI), a key inflation reading ahead of the Federal Reserve's December interest rate decision. Th
Author  TradingKey
18 hours ago
On Tuesday (Nov. 10) Eastern Time, the U.S. will release the October Consumer Price Index (CPI), a key inflation reading ahead of the Federal Reserve's December interest rate decision. Th
Related Instrument
goTop
quote