

Silver Price Forecast: XAG/USD consolidates below $29.00/100-period SMA ahead of NFP
- Silver consolidates its recovery gains from a multi-week low registered over the past two days.
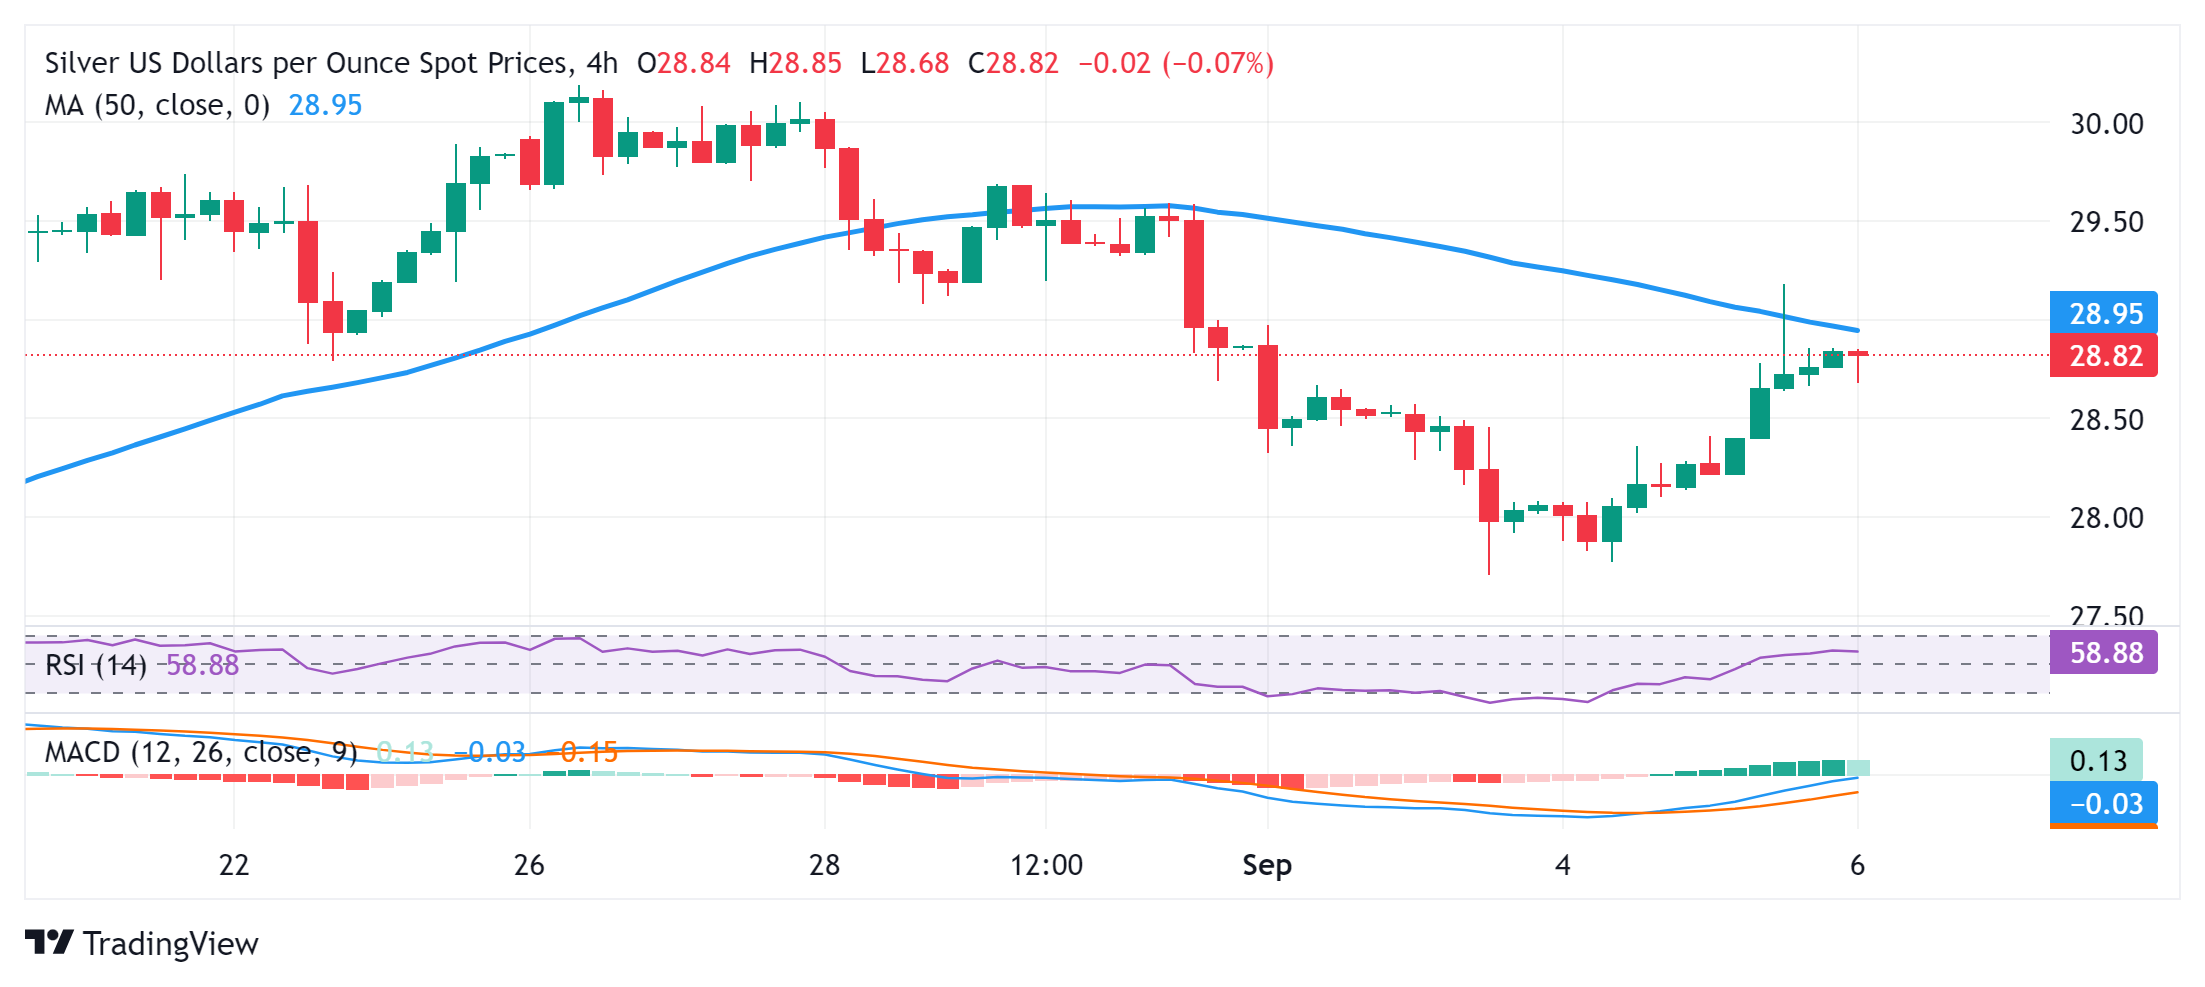
- The overnight failure near the 100-period SMA on the 4-hour chart warrants caution for bulls.
- A sustained move above the $29.00 mark is needed to support prospects for additional gains.
Silver (XAG/USD) oscillates in a narrow trading band, around the $28.80 region during the Asian session on Friday and remains below the weekly top touched the previous day. Traders now seem reluctant and prefer to wait for the release of the crucial US Nonfarm Payrolls (NFP) report before pacing fresh directional bets.
Looking at the broader picture, the overnight failure to find acceptance above the $29.00 mark, or the 100-period Simple Moving Average (SMA) on the 4-hour chart, warrants some caution for bullish traders. Moreover, neutral oscillators on the daily chart make it prudent to wait for a sustained strength beyond the said handle before positioning for an extension of the XAG/USD's recent bounce from the $27.70 area, or a nearly three-week low set on Tuesday.
The subsequent move up has the potential to lift the white metal further towards the $29.65 intermediate hurdle en route to the $30.00 psychological mark. Some follow-through buying beyond the August monthly swing high, around the $30.20 region, will be seen as a fresh trigger for bulls and pave the way for a further appreciating move. The XAG/USD might then climb to the $30.80 horizontal resistance before aiming to reclaim the $31.00 round-figure mark.
On the flip side, immediate support is pegged near the $28.50 region, below which the commodity could accelerate the slide towards the $28.00 mark. This is followed by the weekly trough, around the $27.70 zone. A convincing break below the latter might prompt aggressive technical selling and drag the XAG/USD to the $27.20 intermediate support en route to the $27.00 round figure and the next relevant support near the $26.60 area.
Silver 4-hour chart
Silver FAQs
Silver is a precious metal highly traded among investors. It has been historically used as a store of value and a medium of exchange. Although less popular than Gold, traders may turn to Silver to diversify their investment portfolio, for its intrinsic value or as a potential hedge during high-inflation periods. Investors can buy physical Silver, in coins or in bars, or trade it through vehicles such as Exchange Traded Funds, which track its price on international markets.
Silver prices can move due to a wide range of factors. Geopolitical instability or fears of a deep recession can make Silver price escalate due to its safe-haven status, although to a lesser extent than Gold's. As a yieldless asset, Silver tends to rise with lower interest rates. Its moves also depend on how the US Dollar (USD) behaves as the asset is priced in dollars (XAG/USD). A strong Dollar tends to keep the price of Silver at bay, whereas a weaker Dollar is likely to propel prices up. Other factors such as investment demand, mining supply – Silver is much more abundant than Gold – and recycling rates can also affect prices.
Silver is widely used in industry, particularly in sectors such as electronics or solar energy, as it has one of the highest electric conductivity of all metals – more than Copper and Gold. A surge in demand can increase prices, while a decline tends to lower them. Dynamics in the US, Chinese and Indian economies can also contribute to price swings: for the US and particularly China, their big industrial sectors use Silver in various processes; in India, consumers’ demand for the precious metal for jewellery also plays a key role in setting prices.
Silver prices tend to follow Gold's moves. When Gold prices rise, Silver typically follows suit, as their status as safe-haven assets is similar. The Gold/Silver ratio, which shows the number of ounces of Silver needed to equal the value of one ounce of Gold, may help to determine the relative valuation between both metals. Some investors may consider a high ratio as an indicator that Silver is undervalued, or Gold is overvalued. On the contrary, a low ratio might suggest that Gold is undervalued relative to Silver.
Recommended Articles


