

Gold hits resistance after rallying on lower yields and geopolitical tensions
- Gold rally hits resistance from the top of its late-summer range and pulls back.
- Bullish drivers are strong in the form of simmering geopolitical tensions and falling US bond yields.
- US inflation data this week could color the outlook and increase volatility for Gold.
Gold (XAU/USD) is trading in the $2,460s on Tuesday after rallying up to a key chart resistance level in the $2,470s on the previous day. The rally was stimulated by falling US bond yields, which are inversely correlated to Gold, and a growing threat of escalation of conflict in the Middle East.
Gold is now pulling back from Monday’s highs as traders take profit ahead of US inflation data scheduled for Tuesday and Wednesday. The US Producer Price Index (PPI) comes out on Tuesday, and the US Consumer Price Index (CPI) is out on Wednesday. Both could color the outlook for interest rates in the US, a key driver for Gold’s price.
Gold rallies on the back of falling US bond yields
Gold has been rallying on the back of heightened expectations that the Federal Reserve (Fed) might begin aggressively cutting interest rates in September. Previously expecting a modest 0.25% cut, which would bring the fed funds rate down to 5.25%, market gauges now predict a 49.5% chance of a bigger 0.50% cut, bringing the fed funds rate down to 5.00%.
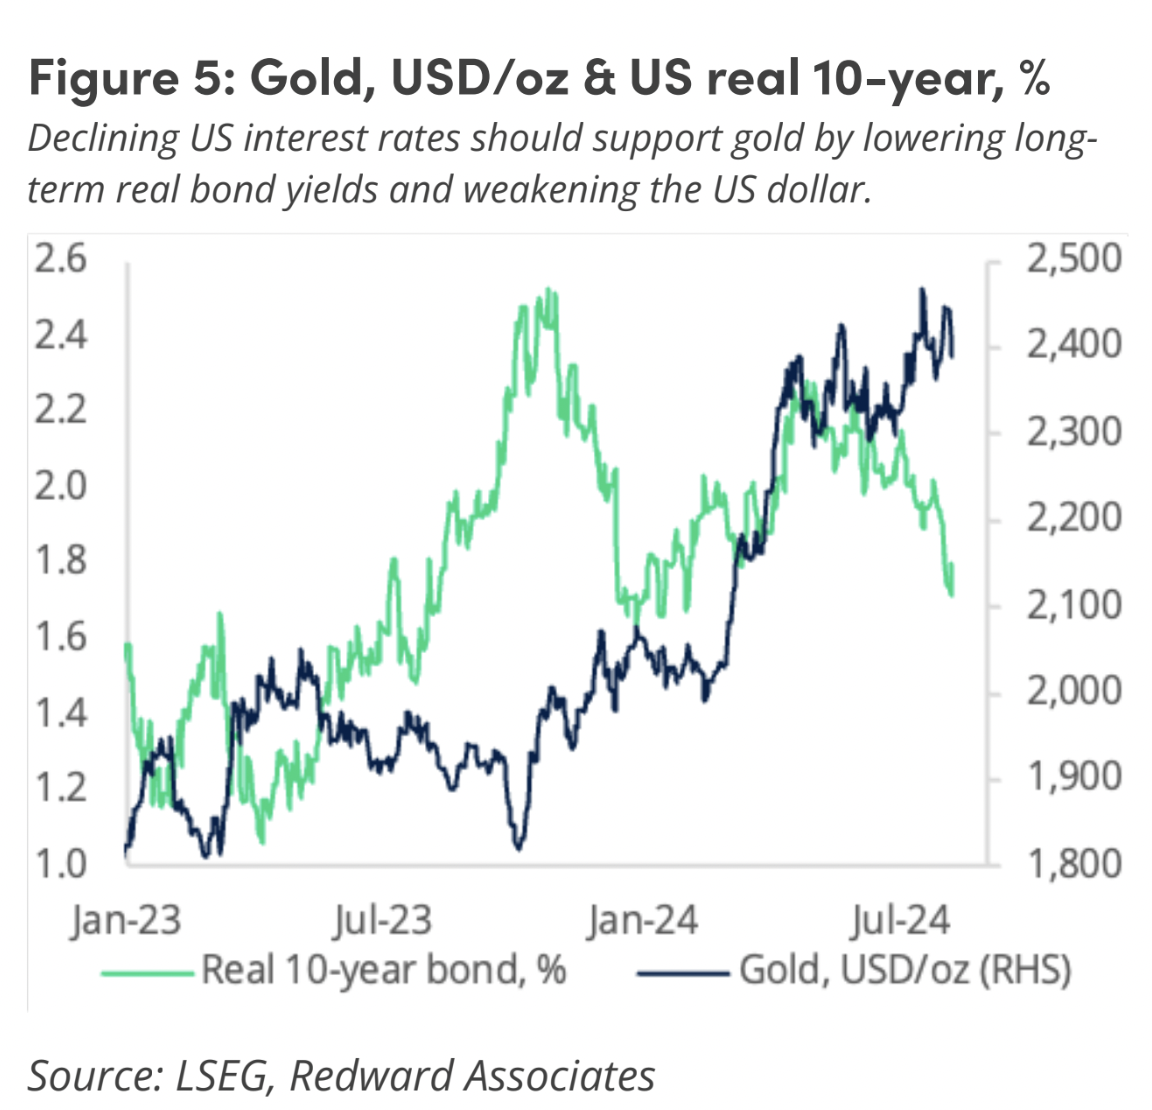
Lower bond yields reflect lower interest rate expectations, which are generally positive for Gold’s price. Gold is a more attractive asset when interest rates are low since it doesn't pay the holder any interest, unlike cash or its equivalents. Therefore, yields and Gold price are negatively correlated, as shown in the chart below, which compares Gold price to the yield on US 10-year Treasury Bonds.
Interest rate expectations will be colored by the US PPI and CPI data results out on Tuesday (today) and Wednesday. If PPI inflation, also known as “factory gate” inflation, comes out lower than the expected 0.1% month-over-month, it will confirm downward pressure on the wholesale price of manufactured goods. This may then feed into the price of consumer goods, leading to a weaker broader outlook for inflation and supporting expectations of lower interest rates. This, in turn, is likely to push up Gold. Conversely, the precious metal is likely to fall if PPI comes out higher than expected.
US Consumer Price Index (CPI) data for July, is to be released on Wednesday, and could further color expectations regarding future changes to interest rates. This, in turn, could impact Gold.
US CPI is expected to have risen by 0.2% in July compared with the previous month, both for headline and core. This comes after a 0.1% decline for headline and a 0.1% rise for core in June. If the real figure overshoots expectations, indicating sticky prices, it could bring into doubt the assumption the Fed will cut interest rates aggressively in September, hurting Gold price in the process.
Geopolitical Risk
Central bank demand for Gold peaked at the start of Russia’s invasion of Ukraine, highlighting Gold’s role as a safe haven. This demand has tapered off over time, according to Redward Associates, which collaborates with the spread-better IG index to produce a Monthly Gold Report.
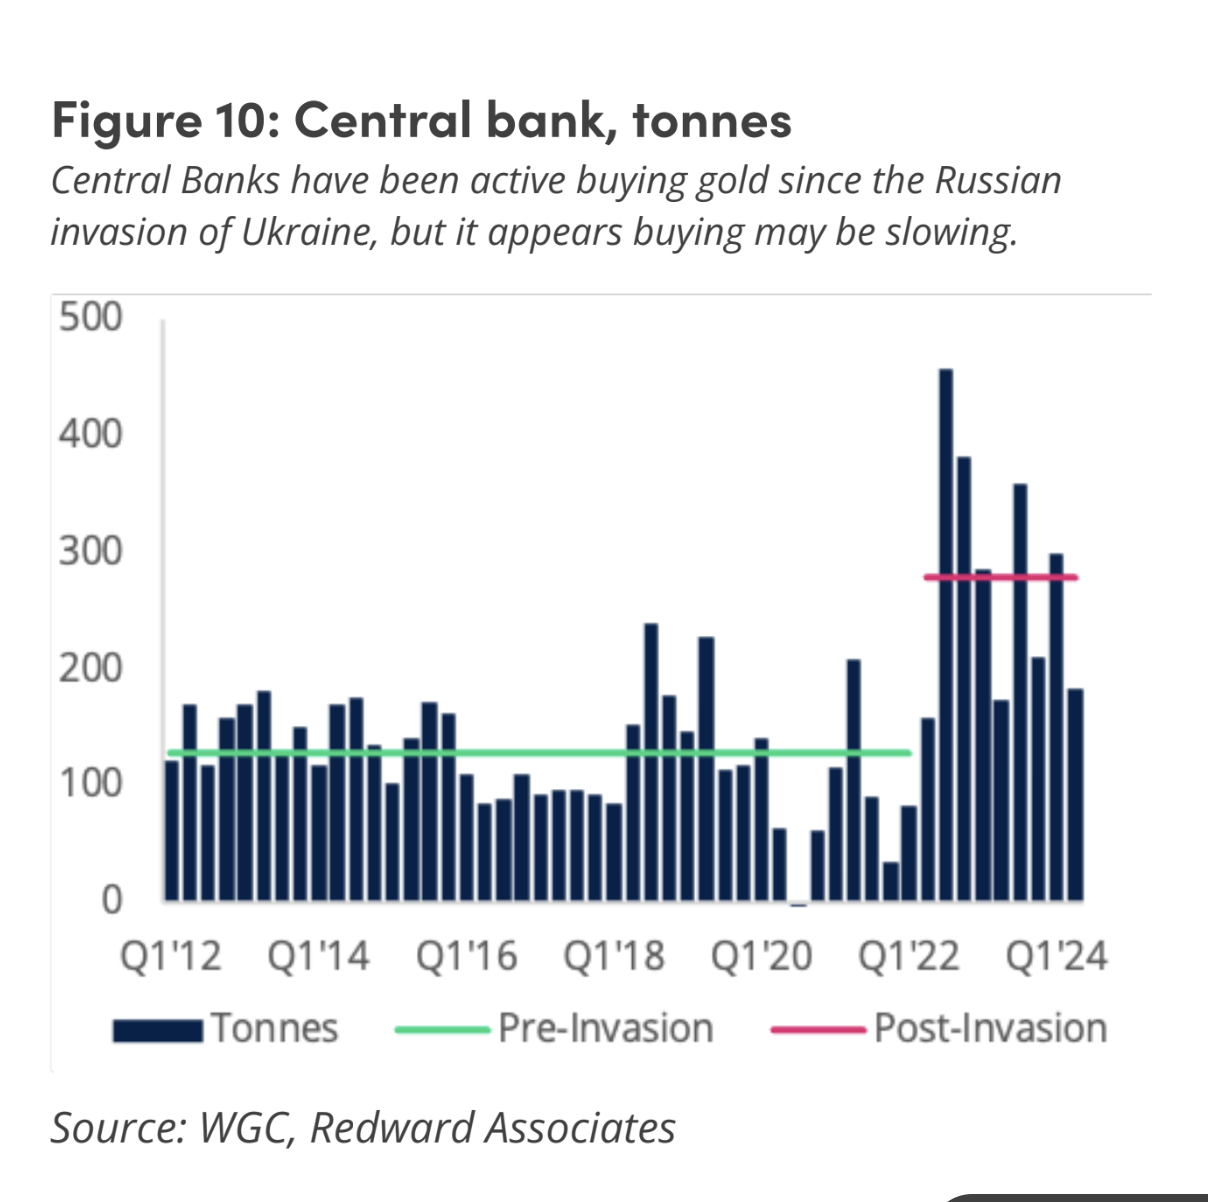
If Iran mounts a large-scale military attack on Israel, however, similar levels of demand could be foreseen, pushing up the Gold price as a consequence. Additionally, Ukraine has raised the stakes in its war against Russia by invading Russian territory, and this could revive Gold buying from investors. If either of these hotspots increasingly threatens global stability, investors are likely to respond by buying up Gold for its safe-haven properties.
Gold positioning is a drag
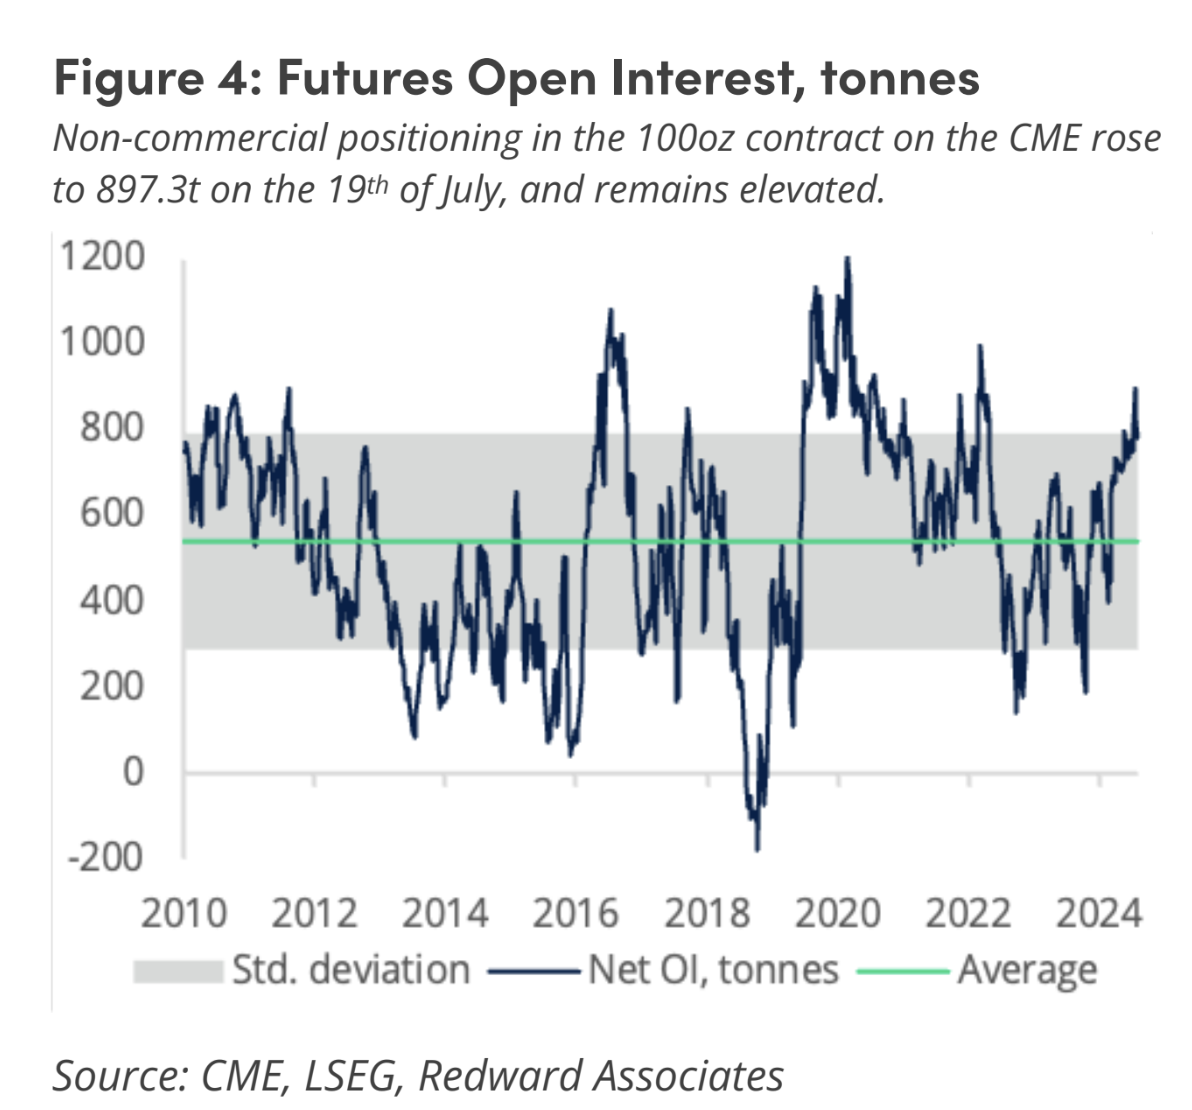
Despite the multiple bullish factors converging to push up the price of Gold, the data from Gold exchanges shows positioning in the Gold derivatives markets has reached an overextended level that may indicate a vulnerability to pullback, reflecting a reduction in demand and fall in the price of underlying Gold.
The graphic below shows how Gold Futures positioning has moved over a standard deviation away from the average, suggesting an overextension of long positions. The usual response is for positioning to mean-revert, indicating a risk of a pullback.
The over-the-counter Options market is also showing a disproportionate preference for bullish call options, reflecting optimism, according to the Redward Associates and IG Index report. The “option volatility skewed in favor of Gold call options at all tenors out to twelve months, with one-month option, volatility skewed 2.1% in favor of calls,” the report says.
“While we see good reason for this optimism - notably ongoing solid Central Bank demand for Gold, coupled with the expectation of easier US monetary conditions leading to a weaker US Dollar and lower US real long-term Bond yields - positioning and technical indicators pointed to position extension,” the report says.
Technical Analysis: Gold touches top of range and pulls back
Gold has rallied up to the ceiling of a range it has been oscillating in since July. After touching this ceiling on Monday, it has pulled back. The trend is probably sideways and, given “the trend is your friend”, likely to extend in that direction.
XAU/USD 4-hour Chart
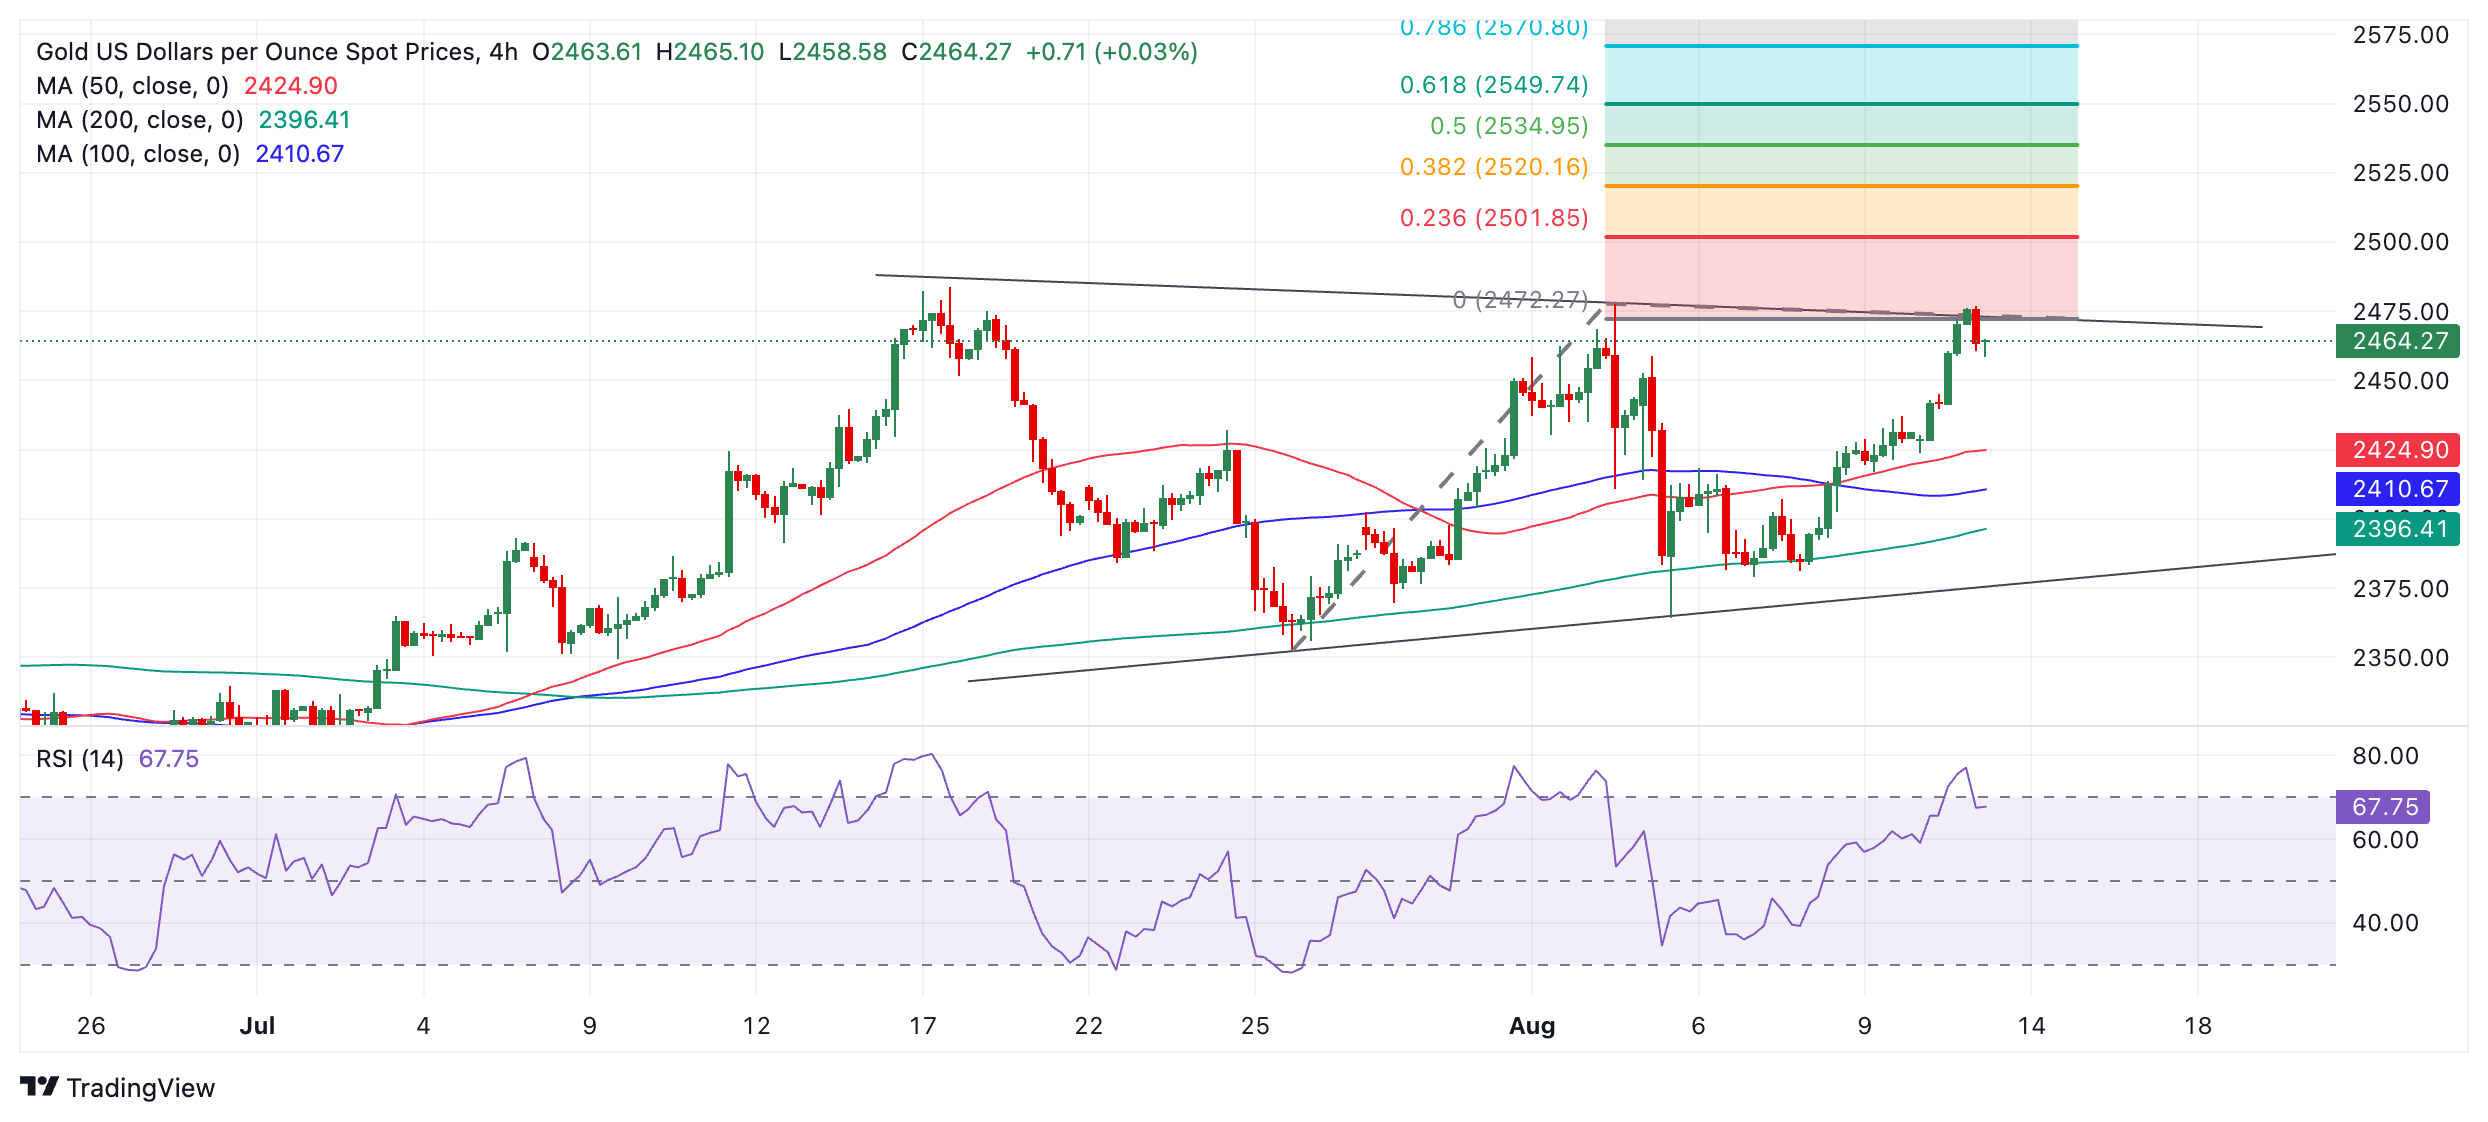
The pair has rolled over after reaching a high of $2,477 earlier in the day and looks poised to start a fresh down leg within the range, thereby extending the sideways trend. A bearish Engulfing Japanese candlestick pattern has formed at the top of the range, and if the current 4-hour period ends as a bearish red candle, this will provide added confirmation of a short-term reversal lower. If so, the price will probably move down to $2,400 at the very least or perhaps the range floor in the $2,390s. Due to the fact the range is tapering slightly, it might also be a triangle pattern in the final stages of development.
A decisive break above the range ceiling, however, would be required to indicate a more bullish trend was developing. Such a move would likely run up to at least $2,550, calculated by taking roughly the 0.618 Fibonacci ratio of the range’s height and extrapolating it higher.
A decisive break would be one characterized by a long green candle that pierced clearly through the level and closed near its high, or three green candles in a row that breached the level.
Economic Indicator
Producer Price Index (MoM)
The Producer Price Index released by the Bureau of Labor statistics, Department of Labor measures the average changes in prices in primary markets of the US by producers of commodities in all states of processing. Changes in the PPI are widely followed as an indicator of commodity inflation. Generally speaking, a high reading is seen as positive (or bullish) for the USD, whereas a low reading is seen as negative (or bearish).
Read more.Next release: Tue Aug 13, 2024 12:30
Frequency: Monthly
Consensus: 0.1%
Previous: 0.2%
Source: US Bureau of Labor Statistics
Recommended Articles


