

Crude Oil climbs as geopolitical tensions highlight supply weak points
- WTI tested multi-week highs on Monday as market tensions rise.
- Ukraine attacked a Russian fuel terminal, increasing market instability.
- Geopolitical risks continue to keep barrel prices on the high side.
West Texas Intermediate (WTI) prices hit a one-month high of $75.42 on Monday after it was reported that Ukraine attacked a Russian fuel terminal using explosive drones, according to reporting by the BBC and the Wall Street Journal.
Global energy markets continue to get unnerved by the increasing potential for supply constraints as a successful Ukraine attack on Russian oil infrastructure highlights how easy it is to topple wide-reaching energy supply chains.
Between Ukraine targeting Russian energy infrastructure and Iran-backed Houthi rebels continuing to ramp up attacks on civilian cargo ships in the Red Sea, Crude Oil markets remain exposed to growing instability hobbling global trade if tensions continue to mount into a broader spill-over of multiple conflicts.
Despite ongoing geopolitical tensions and the risk they pose to Crude Oil supply, global production continues to keep prices capped after 2023’s fearful bids on the possibility of constrained energy markets failing to meet barrel demand bore almost no fruit.
2024 sees global oil production output and exporting continuing to climb despite hopeful production quotas from the Organization of the Petroleum Exporting Countries (OPEC) getting undercut by US Crude Oil production rising into historical highs.
WTI Technical Outlook
WTI climbed nearly 4% bottom-to-top on Monday, rising from $72.55 to test into $75.42, settling back into $74.64 as markets head into the Tuesday market session.
US Crude Oil is caught in a congestion zone between the 50-day and 200-day Simple Moving Averages (SMA) between $78.00 and $73.00, trading into a tight consolidation range after slumping through the 200-day SMA in November.
WTI Hourly Chart
WTI Daily Chart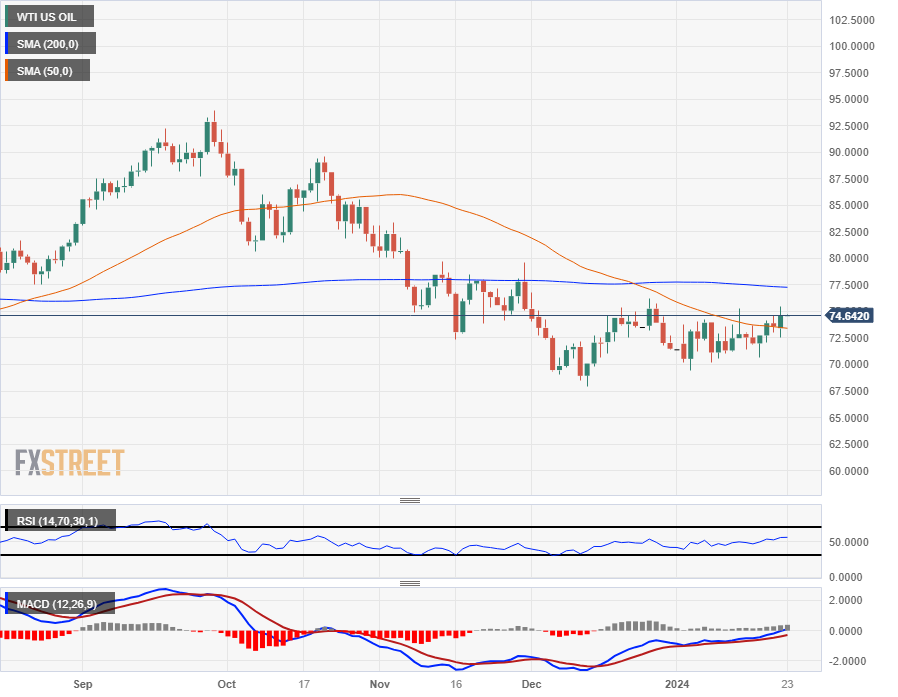
Recommended Articles


