

Natural Gas drops lower with European storage on track
- Natural Gas edges lower at the start of the week on the EU Gas storage report.
- Traders see European Gas storages top 80%, despite Freeport delays.
- The US Dollar index trades choppy on the back of Trump’s shooting over the weekend.
Natural Gas price (XNG/USD) ticks down on Monday after European data showed Germany’s Gas storage facilities are near 85%, while overall Europe is doing great with 81%. Traders betting on higher Gas prices are facing substantial losses despite their bets on the delay in the reopening of the Texas Freeport plant. The Liquified Natural Gas (LNG) plant is still not producing, taking longer to start after it closed last week because Hurricane Beryl passed through the area.
Meanwhile, the US Dollar Index (DXY), which tracks the Greenback’s value against six major currencies, is trading very choppy, torn by other asset classes in reaction to the shooting of former US President Donald Trump. Equities are in the green while the bond market is selling off in the idea that this might be a pivotal point in the campaign that could put Trump on the front foot for another term in the White House. Bond markets are selling off, with yields higher, because of the concern that the current program that Trump wants to bring forward will widen the US deficit and see the US debt exponentially surge.
Natural Gas is trading at $2.26 per MMBtu at the time of writing.
Natural Gas news and market movers: Mixed headlines
- Bloomberg reports that the Freeport LNG plant in Texas still has not produced any flow worth mentioning since it reduced output for Hurricane Beryl last week.
- European Gas storage facilities are confirmed to be near 81% full, which is above the 71.3% 5-year average and sets the bloc up for passing the next fall and winter quite comfortably.
- Newsbase reports that Novatek is growing its foothold in China by offering cargo for late July in an attempt to penetrate China’s domestic Gas market further.
- China reported weak economic growth figures on Monday, which means the big LNG buyer might come out with sluggish demand, Reuters reports.
Natural Gas Technical Analysis: That very last drop
Natural Gas price is set to cover the last few cents in its decline or correction before touching base near the target of $2.13. The Relative Strength Index (RSI) indicator is near the line in the sand for being oversold, which should subsequently result in a bounce higher. The sluggish overall demand and European storage facilities being ahead of refilling schedules might be the elements that bring it to that level.
The 200-day SMA is the first force to reckon with on the upside, near $2.50, closely followed by the 55-day SMA at $2.63. Once back above, the pivotal level near $3.08 (March 6, 2023, high) remains key resistance after its false break in mid-June.
On the downside, there is not much in the way to $2.13. The only element slowing that move is the RSI, which is already very close to being oversold. So any move or drop will be very quick and short-lived, with buyers ready to buy the dip. In case a big bearish catalyst takes place, $1.53 could not be ruled out in the longer term.
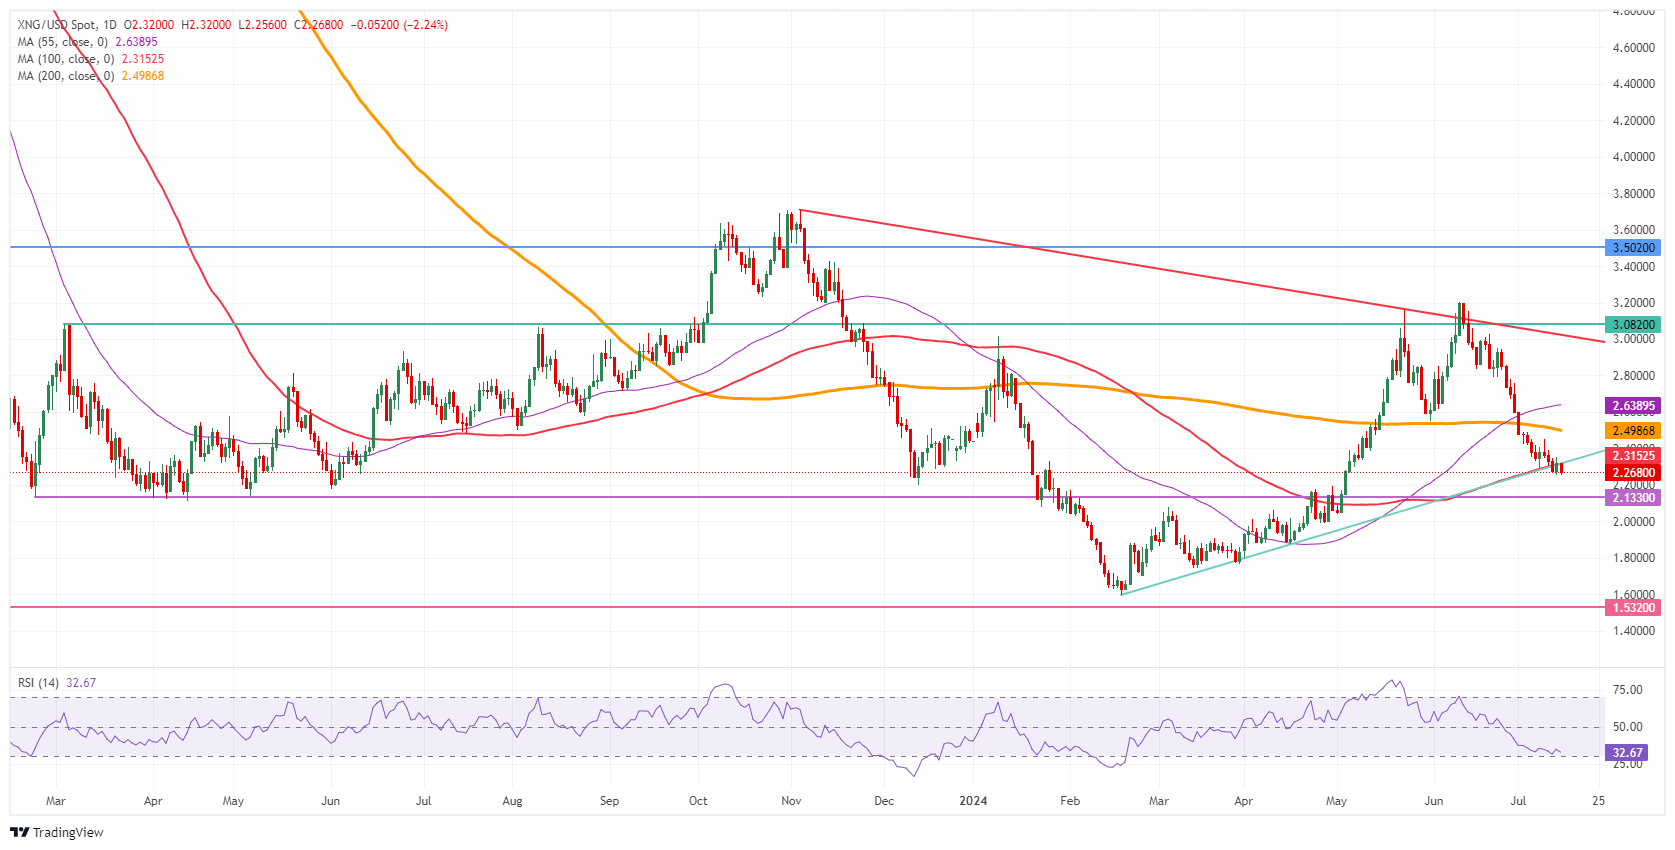
Natural Gas: Daily Chart
Natural Gas FAQs
Supply and demand dynamics are a key factor influencing Natural Gas prices, and are themselves influenced by global economic growth, industrial activity, population growth, production levels, and inventories. The weather impacts Natural Gas prices because more Gas is used during cold winters and hot summers for heating and cooling. Competition from other energy sources impacts prices as consumers may switch to cheaper sources. Geopolitical events are factors as exemplified by the war in Ukraine. Government policies relating to extraction, transportation, and environmental issues also impact prices.
The main economic release influencing Natural Gas prices is the weekly inventory bulletin from the Energy Information Administration (EIA), a US government agency that produces US gas market data. The EIA Gas bulletin usually comes out on Thursday at 14:30 GMT, a day after the EIA publishes its weekly Oil bulletin. Economic data from large consumers of Natural Gas can impact supply and demand, the largest of which include China, Germany and Japan. Natural Gas is primarily priced and traded in US Dollars, thus economic releases impacting the US Dollar are also factors.
The US Dollar is the world’s reserve currency and most commodities, including Natural Gas are priced and traded on international markets in US Dollars. As such, the value of the US Dollar is a factor in the price of Natural Gas, because if the Dollar strengthens it means less Dollars are required to buy the same volume of Gas (the price falls), and vice versa if USD strengthens.
Recommended Articles


