

WTI dips to $70.60 and rebounds as geopolitical risks continue to plague Crude Oil markets
- US Dollar strength is hampering Crude Oil barrel bids.
- Disappointing growth figures from China depress energy markets on demand concerns.
- A late-day rebound brought Crude Oil back on-balance for Wednesday.
Lagging growth from China, steadily increasing global Crude Oil production, and a rising US Dollar (USD) saw West Texas Intermediate (WTI) US Crude Oil fall into a fresh low for the week near $70.60.
Chinese growth figures disappointed early Wednesday, with China’s annualized Gross Domestic Product (GDP) through the fourth quarter missing expectations of 5.3%, printing at 5.2% compared to the previous quarter’s 4.9%.
With Chinese growth failing to hit market expectations, concerns are mounting that China’s demand for fossil fuels will decline looking forward, widening the gap between global demand for Crude Oil and current production rates that are already outpacing demand despite steep production cuts from the Organization for the Petroleum Exporting Countries (OPEC).
With US production continuing to increase Crude Oil production into new all-time highs, OPEC is going to have to commit to even steeper production caps moving forward, a move that will become increasingly undesirable for smaller member states within the oil cartel who are already depressing Crude Oil output as much as their government budgets can afford.
Despite downside pressures, including a rising US Dollar on Wednesday, Crude Oil markets found a leg up on ongoing geopolitical concerns with Iran-backed Houthi rebel is Yemen determined to continue attacking civilian cargo ships passing through the Red Sea en route for the Suez Canal.
Many private logistics companies have rerouted shipping lanes around the continent of Africa to connect Europe and Asia, limiting the potential for supply constraints, but energies markets remain determined to fear the possibility of Crude Oil supply being unable to make it to market amidst Red Sea tensions.
WTI Technical Outlook
WTI’s early decline on Wednesday saw a rebound back above the 200-hour Simple Moving Average (SMA) near $72.40 as US Crude Oil heads back towards the $73.00 handle.
Crude Oil’s back-and-forth on Wednesday sees WTI pushing into the middle of a long-term congestion pattern forming up on daily candlesticks with a nearly-flat 200-day SMA near $78.00 and a declining 50-day SMA pressing down on intraday price action from $74.00.
WTI Hourly Chart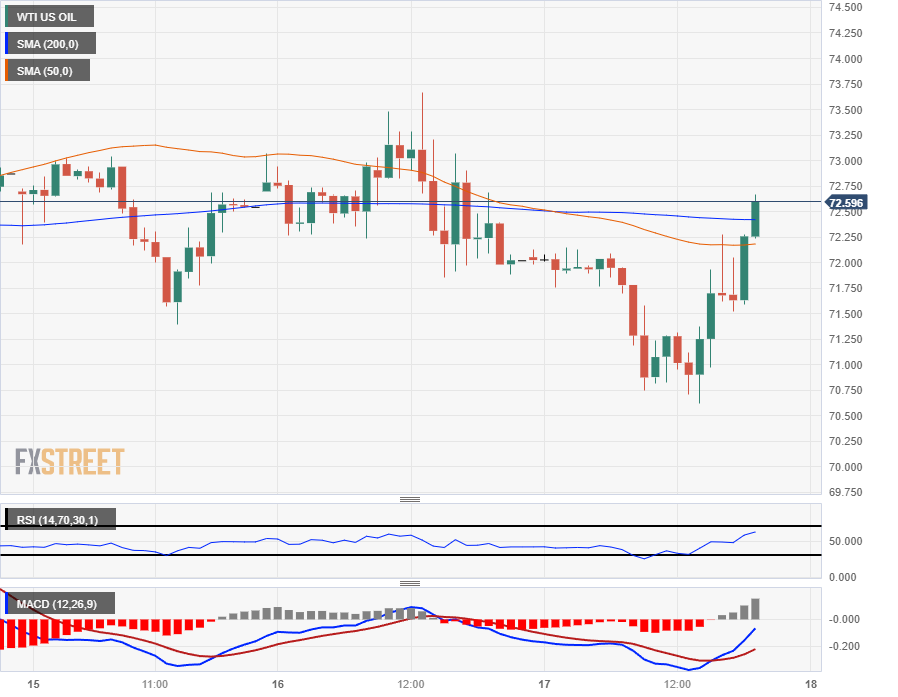
WTI Daily Chart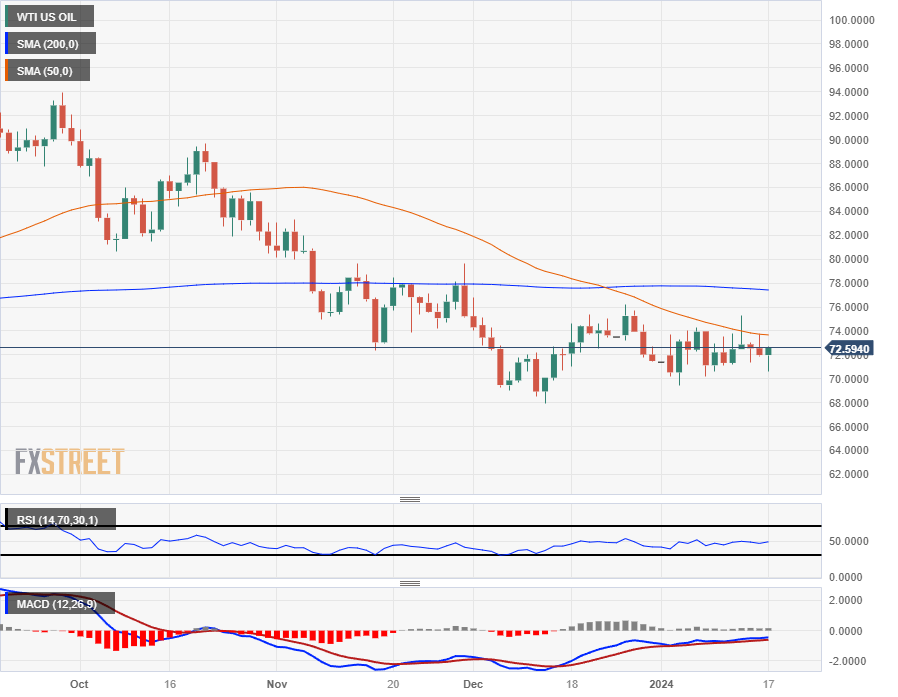
WTI Technical Levels
Recommended Articles


