


Gold price surges on weak US inflation data, Fed rate cut expectations grow
- Gold skyrockets above $2,400 after softer US CPI sparks hopes for Fed rate cuts in 2024.
- US 10-year Treasury yield drops 10 basis points to 4.187%, boosting Gold’s appeal.
- CME FedWatch Tool shows 85% odds for September rate cut; US Dollar Index falls to 104.48.
Gold prices skyrocketed sharply during Thursday’s North American session after the release of the Consumer Price Index (CPI) in the United States opened the door for the Federal Reserve (Fed) to lower borrowing costs. Hence, US Treasury yields tanked, a tailwind for the precious metal. The XAU/USD trades at $2,414, up more than 1.80% after bouncing off daily lows of $2,371.
Market sentiment shifted sour as the S&P 500 and the Nasdaq 100 sank sharply, while the Dow Jones Industrial advanced. US yields are collapsing with the 10-year Treasury note yield down 10 basis points to 4.187%.
Data from the US Bureau of Labor Statistics (BLS) revealed that consumer prices deflated in June. Excluding volatile items like food and energy, the so-called core dipped as well, reigniting hopes that the Fed could cut rates in 2024.
The CME FedWatch Tool shows 85% odds for a quarter-point percentage rate cut in September, up from Wednesday’s 70% chances.
The December 2024 fed funds rate futures contract implies that the Fed will ease policy by 49 basis points (bps) toward the end of the year, up from 39 a day ago.
Other data showed the labor market remains robust as the number of Americans filing for unemployment benefits missed the consensus and came in lower than the previous reading.
Today's US data presents a balanced Goldilocks scenario: inflation is decreasing while employment remains strong, with no signs of an impending recession.
Meanwhile, the US Dollar Index (DXY), which tracks the value of a basket of six currencies against the US Dollar, plummeted more than 0.40% and is down at 104.48.
Ahead of the week, the US economic schedule will feature the Producer Price Index (PPI) for June and the University of Michigan Consumer Sentiment survey for the same period.
Daily digest market movers: Gold soars due to Fed rate cut hopes
- June US Consumer Price Index (CPI) contracted by -0.1% MoM, missing the forecast of a 0.1% increase. Core CPI also ticked lower from 0.2% in May to 0.1% in June, aligned with estimates.
- Over the 12 months to June, headline US inflation dropped to 3%, down from 3.3%, while core inflation slumped to 3.3%, below estimates and down from the previous month's 3.4%.
- Initial Jobless Claims for the week ending July 6 came in better than expected at 222K, below the consensus of 236K and the previous reading of 239K.
- According to the CME FedWatch Tool, odds of a September rate cut have increased to 84%, up from 72% on Wednesday.
- Bullion prices retreated somewhat due to the People’s Bank of China’s (PBoC) decision to halt Gold purchases in June as it did in May. China held 72.80 million troy ounces of the precious metal at the end of June.
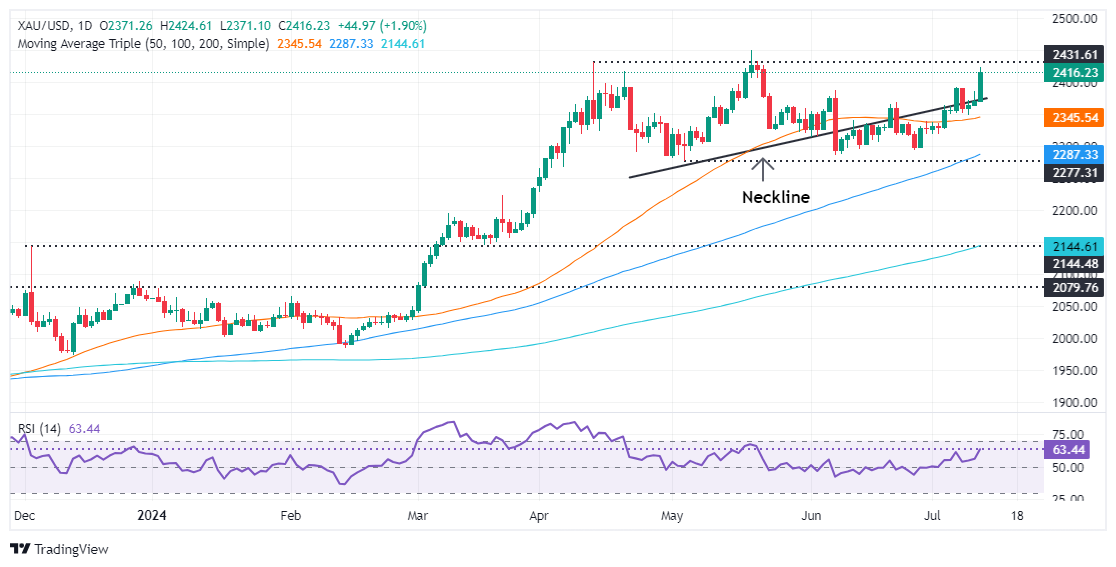
Technical analysis: Gold price climbs above $2,400, invalidates Head-and-Shoulders
Gold price resumed its aggressive uptrend and decisively broke the Head-and-Shoulders neckline, invalidating the chart pattern and opening the door for higher prices. Momentum remains on the buyers' side, with the Relative Strength Index (RSI) finally showing signs of direction, trending up.
That said, the path of least resistance is to the upside. The XAU/USD first resistance would be the year-to-date high of $2,450, ahead of the $2,500 mark. Conversely, if Gold slides below the $2,400 figure, the next demand zone will be the July 5 high at $2,392. If cleared, XAU/USD would continue to $2,350
Gold FAQs
Gold has played a key role in human’s history as it has been widely used as a store of value and medium of exchange. Currently, apart from its shine and usage for jewelry, the precious metal is widely seen as a safe-haven asset, meaning that it is considered a good investment during turbulent times. Gold is also widely seen as a hedge against inflation and against depreciating currencies as it doesn’t rely on any specific issuer or government.
Central banks are the biggest Gold holders. In their aim to support their currencies in turbulent times, central banks tend to diversify their reserves and buy Gold to improve the perceived strength of the economy and the currency. High Gold reserves can be a source of trust for a country’s solvency. Central banks added 1,136 tonnes of Gold worth around $70 billion to their reserves in 2022, according to data from the World Gold Council. This is the highest yearly purchase since records began. Central banks from emerging economies such as China, India and Turkey are quickly increasing their Gold reserves.
Gold has an inverse correlation with the US Dollar and US Treasuries, which are both major reserve and safe-haven assets. When the Dollar depreciates, Gold tends to rise, enabling investors and central banks to diversify their assets in turbulent times. Gold is also inversely correlated with risk assets. A rally in the stock market tends to weaken Gold price, while sell-offs in riskier markets tend to favor the precious metal.
The price can move due to a wide range of factors. Geopolitical instability or fears of a deep recession can quickly make Gold price escalate due to its safe-haven status. As a yield-less asset, Gold tends to rise with lower interest rates, while higher cost of money usually weighs down on the yellow metal. Still, most moves depend on how the US Dollar (USD) behaves as the asset is priced in dollars (XAU/USD). A strong Dollar tends to keep the price of Gold controlled, whereas a weaker Dollar is likely to push Gold prices up.
Recommended Articles


