

Oil looks set for second straight week of gains as US stockpiles fall
- Oil prices are set for a second consecutive week of gains despite facing a bit of profit-taking on Friday.
- Traders see a rosy outlook for US demand in the short term while inventories fell more than expected last week.
- The US Dollar Index trades firmly above 105.50, with help from the Japanese Yen and Euro.
Oil prices retreat slightly on Friday but look set to close in the green for the second week in a row, adding over 7% of gains in two weeks. The drawdown in US stockpiles, together with the Southern belt in the US getting ready for the first tropical storms to hit, could mean some short-term supply hiccups.
Meanwhile, the US Dollar Index (DXY), which tracks the performance of the US Dollar against six major currencies, is comfortably up in the higher 105.00 area, nearing 106.00. The move was initiated overnight when Nvidia (NVDA) shredded $91 billion in market value in just one trading session, triggering a massive move into the safe-haven Greenback. On Friday, European Purchasing Managers Index (PMI) numbers signaled the Eurozone economy is losing momentum, ahead of the US PMIs later this Friday.
At the time of writing, Crude Oil (WTI) trades at $81.00 and Brent Crude at $84.56.
Oil news and market movers: Drawdowns ahead of hurricane season
- The US Energy Information Administration reported on Thursday that crude stockpiles fell by more than 2.5 million barrels this week, more than the 2 million drawdown expected , triggering another leg up for Crude prices to pop above $80.00, Bloomberg reported.
- Due to bad weather, the Corpus Christi area in Texas suspended most activities in Oil drilling and exporting. Mexico will shut down as well some fuel-importing terminals, according to Reuters.
- Reuters reports that Mexican State Oil company Pemex will begin processing crude at its Dos Bocas refinery in the second half of 2024.
- Baker Hughes US Oil Rig Count will start to gain importance as a number as the hurricane season gets underway. Yhe number for this week will be released at 17:00 GMT, with the previous count at 488.
Oil Technical Analysis: US market throwing in its weight
Oil price has managed to jump above a key level by hitting $81.00. It will be vital from here to see first if Crude can withstand profit-taking and manage a daily and weekly close above this level. When that is the case, more upside could come into play towards the 2024 high at $87.12
On the upside, the red descending trend line near $81.00 has been broken and now needs to prove its resilience as support with both a daily and weekly close above it. More room to move higher towards $87.12, the year-to-date high (April 5). Previously, a relatively small pivotal level would act as resistance near $84.00.
On the downside, the big belt of Simple Moving Averages (SMA) should work now as support and no longer allow to see moves below it. That means the 55-day SMA at $79.79, the 100-day SMA at $79.47, and the 200-day SMA at $78.99 should avoid any dips below $79.00. Should those levels not hold, another drop back to $75 could occur.
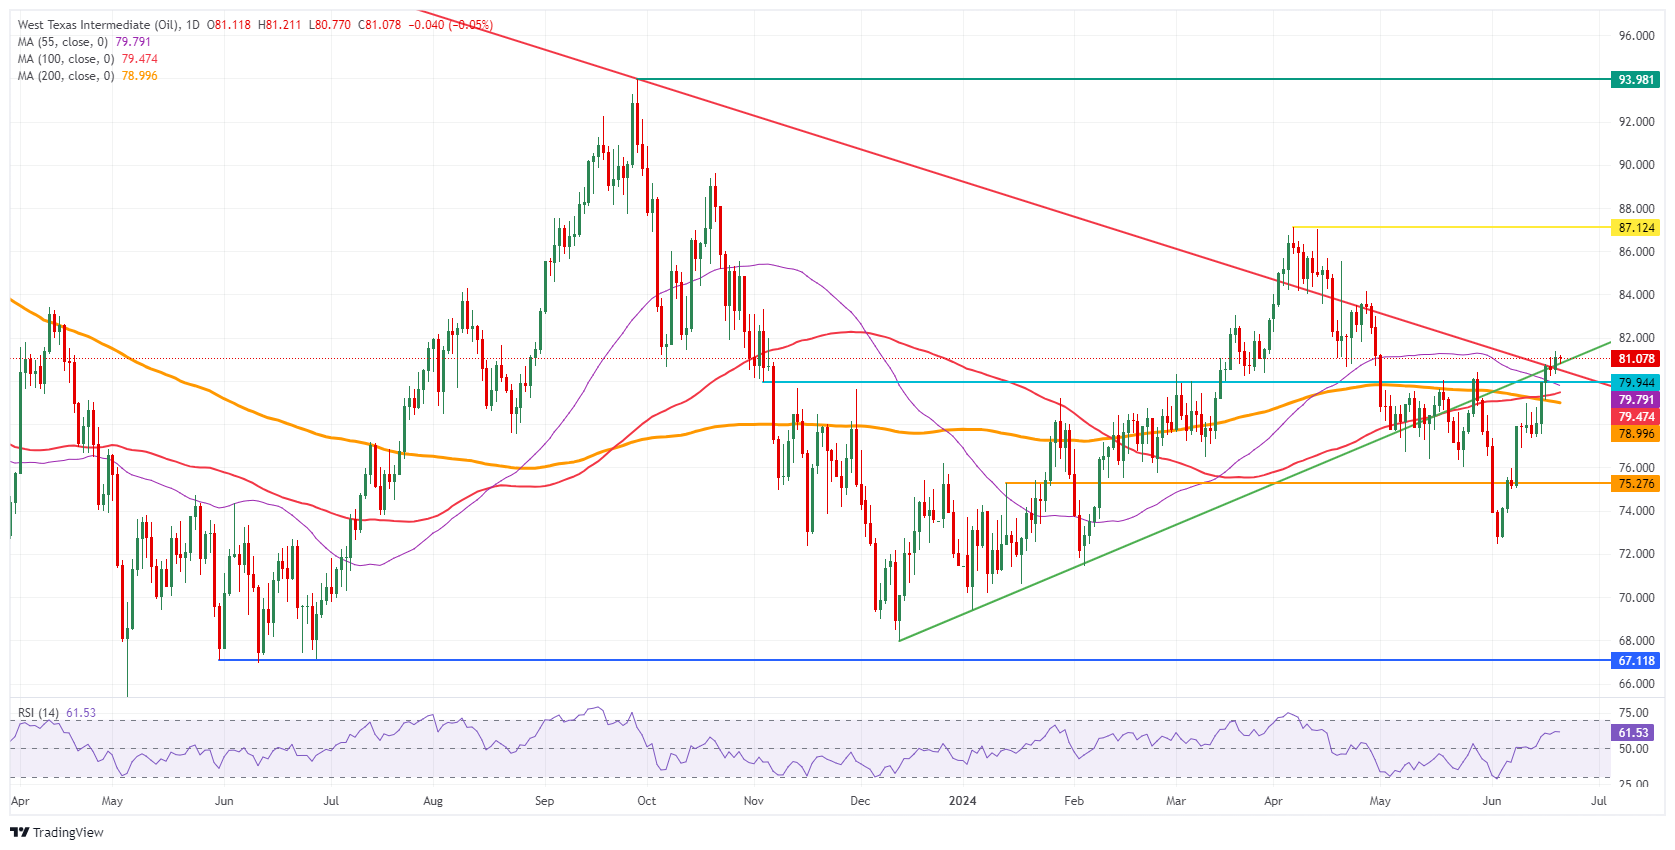
US WTI Crude Oil: Daily Chart
WTI Oil FAQs
WTI Oil is a type of Crude Oil sold on international markets. The WTI stands for West Texas Intermediate, one of three major types including Brent and Dubai Crude. WTI is also referred to as “light” and “sweet” because of its relatively low gravity and sulfur content respectively. It is considered a high quality Oil that is easily refined. It is sourced in the United States and distributed via the Cushing hub, which is considered “The Pipeline Crossroads of the World”. It is a benchmark for the Oil market and WTI price is frequently quoted in the media.
Like all assets, supply and demand are the key drivers of WTI Oil price. As such, global growth can be a driver of increased demand and vice versa for weak global growth. Political instability, wars, and sanctions can disrupt supply and impact prices. The decisions of OPEC, a group of major Oil-producing countries, is another key driver of price. The value of the US Dollar influences the price of WTI Crude Oil, since Oil is predominantly traded in US Dollars, thus a weaker US Dollar can make Oil more affordable and vice versa.
The weekly Oil inventory reports published by the American Petroleum Institute (API) and the Energy Information Agency (EIA) impact the price of WTI Oil. Changes in inventories reflect fluctuating supply and demand. If the data shows a drop in inventories it can indicate increased demand, pushing up Oil price. Higher inventories can reflect increased supply, pushing down prices. API’s report is published every Tuesday and EIA’s the day after. Their results are usually similar, falling within 1% of each other 75% of the time. The EIA data is considered more reliable, since it is a government agency.
OPEC (Organization of the Petroleum Exporting Countries) is a group of 13 Oil-producing nations who collectively decide production quotas for member countries at twice-yearly meetings. Their decisions often impact WTI Oil prices. When OPEC decides to lower quotas, it can tighten supply, pushing up Oil prices. When OPEC increases production, it has the opposite effect. OPEC refers to an expanded group that includes ten extra non-OPEC members, the most notable of which is Russia.
Recommended Articles


