

Crude Oil attempts to shrug off supplies buildup, WTI claws back to $74
- Crude Oil markets are struggling to recover from sharp declines.
- US Crude Oil supplies delivered another buildup in measured stocks.
- OPEC set to ease production caps in the coming months.
West Texas Intermediate (WTI) US Crude Oil is grinding higher on Wednesday as energy markets attempt to shrug off another buildup in US Crude Oil stocks. The Organization of the Petroleum Exporting Countries (OPEC) and its extended group of non-member ally states, OPEC , cautioned this week that the global oil cartel is set to phasing out voluntary production cuts as Crude Oil producers grow frustrated at OPEC’s inability to engineer broad-market support for barrel prices.
As oil-heavy nations prepare to pivot away from OPEC production limits in favor of balancing their government budgets, Crude Oil markets are balking at the prospect of even further risks of oversupply as global demand fails to materialize in-line with energy market expectations.
US Crude Oil stocks rose on a weekly basis once again after the American Petroleum Institute (API) reported a 4.052 million barrel buildup in Weekly Crude Oil Stocks, shrugging off a forecast -1.9 million barrel decline and chewing a significant hole in the previous week’s -6.49 million decline. The Energy Information Administration (EIA) reported similar results, with EIA Crude Oil Stocks Change for the week ended May 31 rising 1.233 million when investors were forecasting a -2.3 million barrel decline. Week-on-week EIA barrel counts previously showed a drawdown of -4.156 million barrels.
Crude Oil technical outlook
WTI barrel bids clawed back to $74.00 per barrel on Wednesday, but topside momentum remains thin and US Crude Oil is steeply off near-term highs. Daily candlesticks closed in the red for the last five consecutive trading days, and meagre grains represent the best Crude Oil bidders can do.
WTI remains trapped under near-term technical resistance at the 200-hour Exponential Moving Average (EMA) at $76.10. US Crude Oil tested into its lowest bids since February, and the upside is looking thin.
WTI hourly chart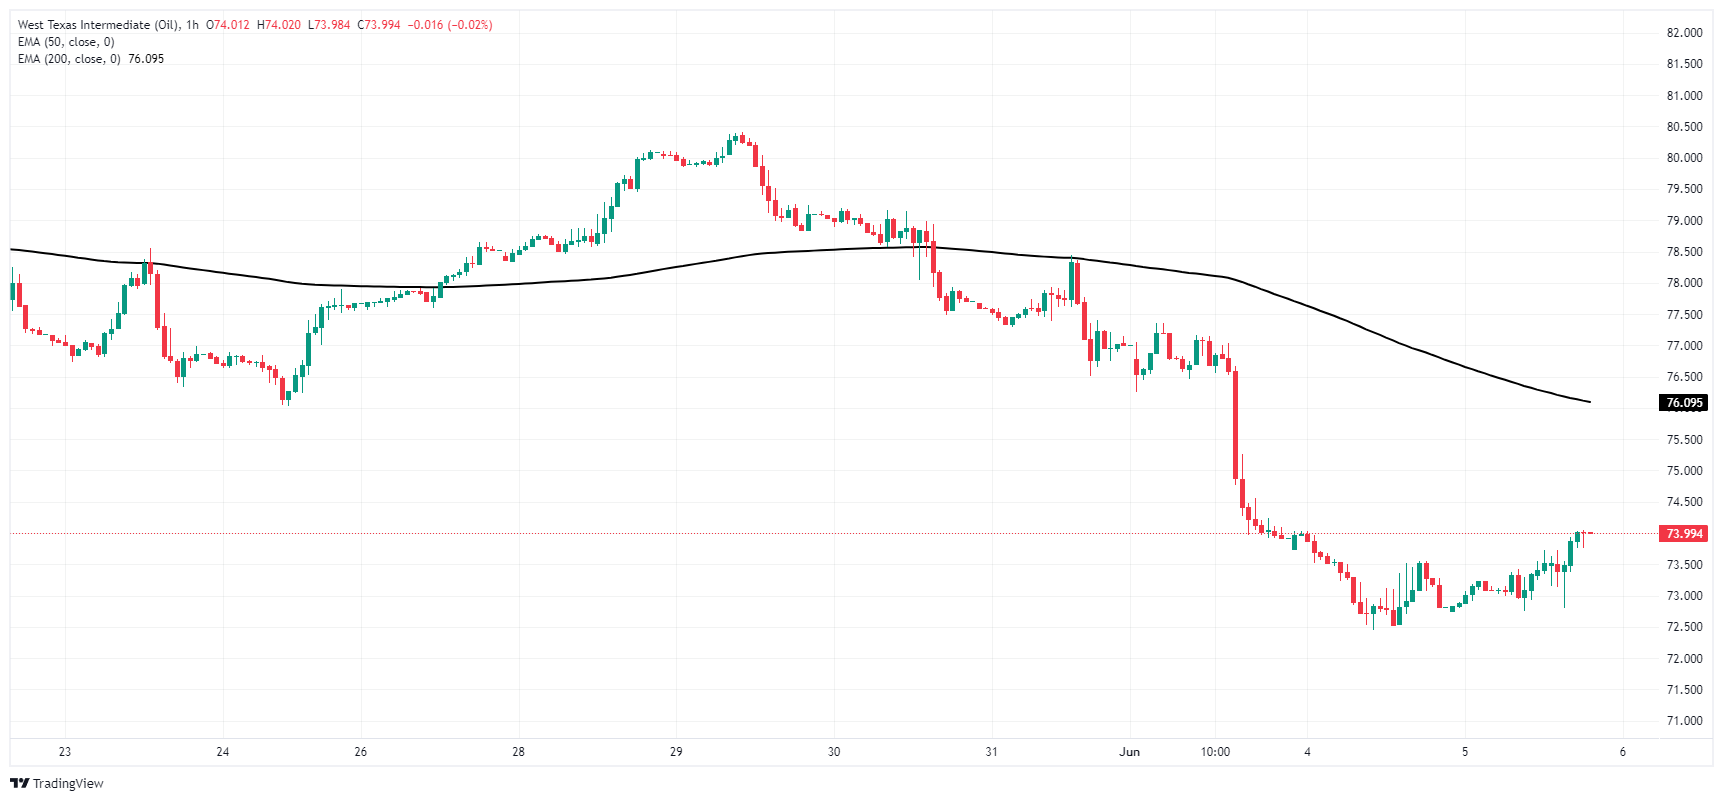
WTI daily chart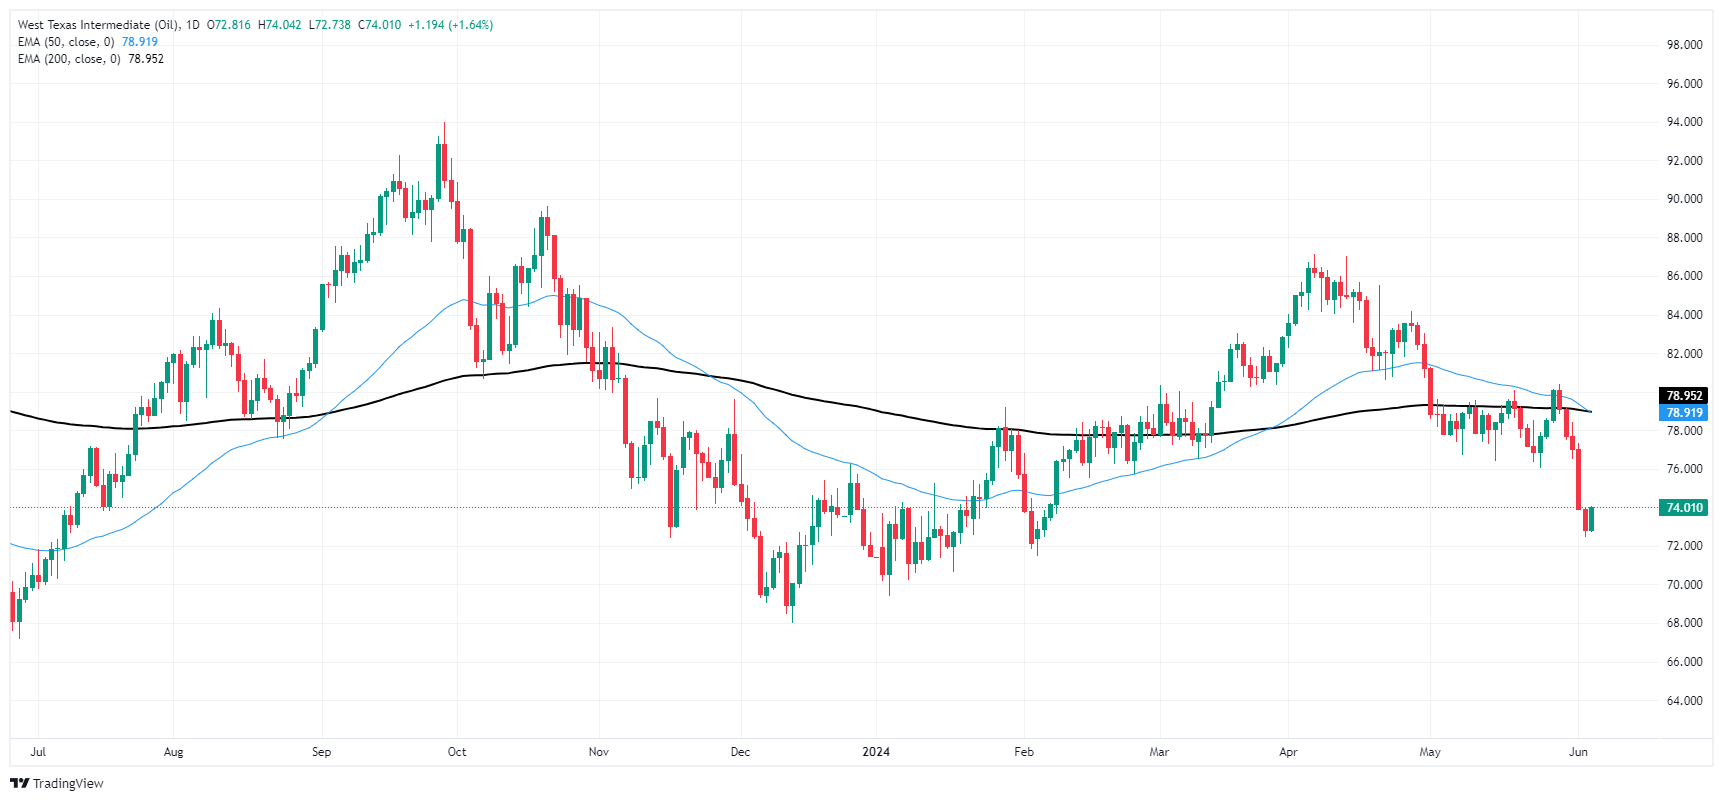
Recommended Articles


