

Crude Oil falls back despite supply declines ahead of anticipated OPEC+ meeting

Source Fxstreet
  • WTI slumps back below $78.00 per barrel as Crude Oil markets recede.
  • A sharp decline in US Crude Oil supplies couldn’t prop up barrel bids.
  • Investor concerns are growing that a reported extention in OPEC cuts will be enough.

West Texas Intermediate (WTI) US Crude Oil backslid on Thursday, with energy markets shrugging off a sharp downturn in reported US Crude Oil stocks. An upcoming meeting of the Organization of the Petroeum Exporting Countries (OPEC) and its extended network of non-member ally states, OPEC , is broadly expected to extend current voluntary production cuts. OPEC kicks off its online-only meeting on Sunday, June 2.

The American Petroleum Institute (API) and Energy Information Administration (EIA) both reported sharp declines in US Crude Oil stocks this week, but energy traders are balking at a huge runup in refined products as refinery runs steeply outproduce demand. The API reported a -6.49 million barrel decline in US Weekly Crude Oil Stocks for the week ended May 24, while the EIA noted a -4.156 million barrel drawdown in Crude Oil Stocks Change for the same period. However, despite the sharp pulldown in Crude Oil supplies, energy traders were knocked back after the EIA reported that refinery-held Crude Oil rose 601,000 per day, notching in the highest level of held refinery crude since December of 2019. The EIA also reported that refinery utilization rates rose by 2.6%.

Holdings of refined Crude Oil products, including gasoline and Natural Gas storage holdings, both rose over the week through May 24, hobbling investment sentiment of Crude Oil markets. OPEC ’s upcoming production meeting is unlikely to resolve energy markets’ concerns.

According to three unnamed sources, OPEC is considering extending some Crude Oil output cuts into 2025, on top of an extension of current voluntary production cuts into Q3 or Q4 of 2024. OPEC ’s current voluntary cuts are already feeling underweight to barrel traders, and Crude Oil bids will be looking for more drastic action from the global oil cartel to crimp an possible overhang in production against global demand.

WTI technical outlook

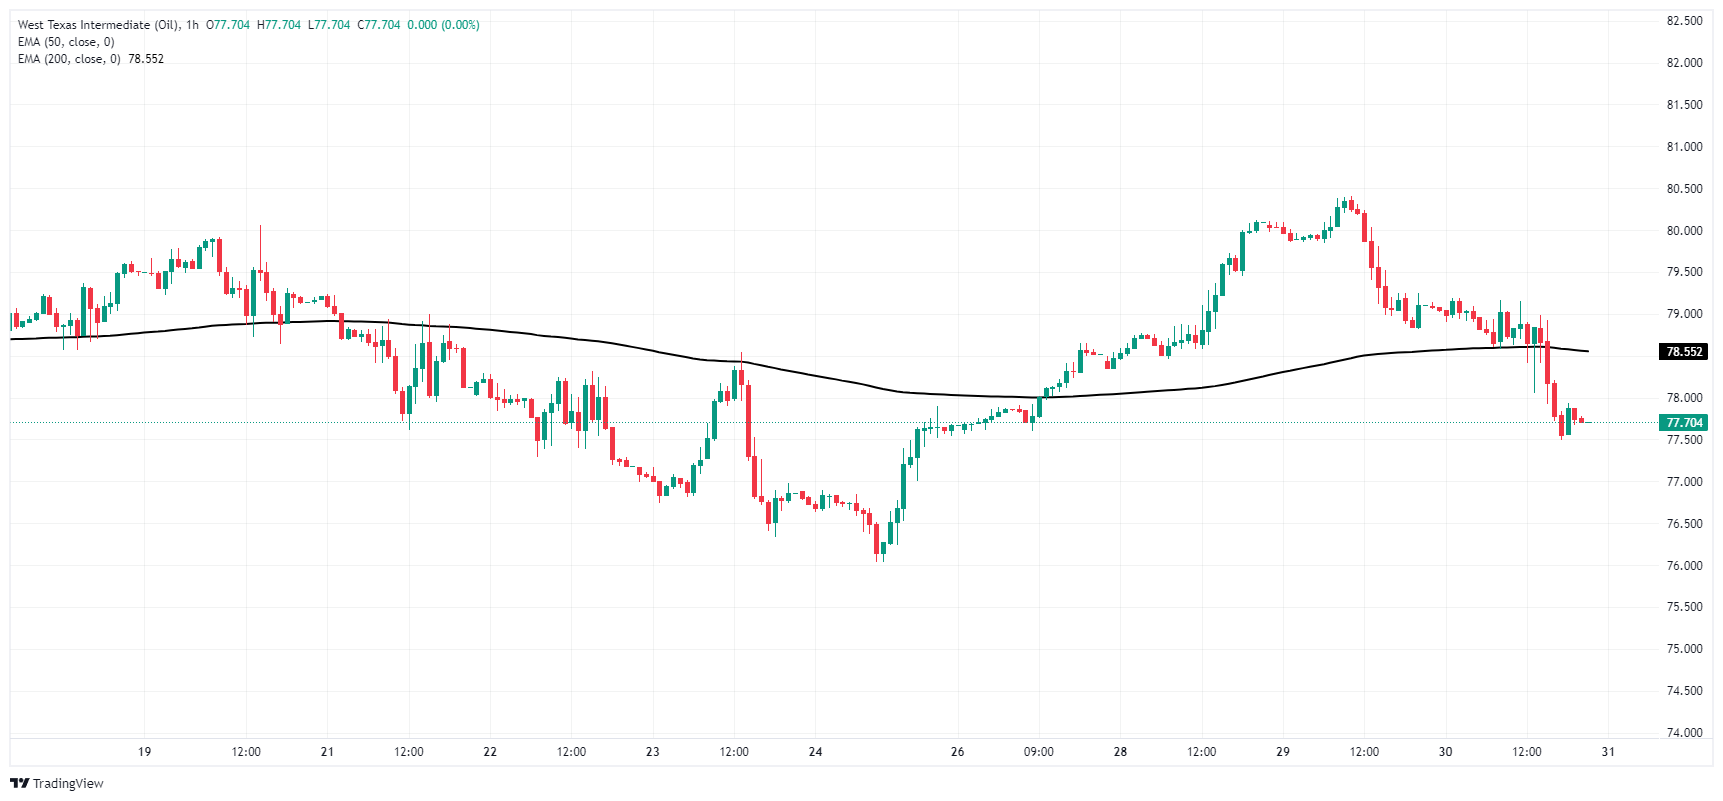
WTI has steepened a near-term decline from this week’s early peak near $80.40, with US Crude Oil tumbling to an intraday low of $77.50 per barrel on Thursday. WTI is still holding above last week’s swing low near $76.00, but topside momentum remains limited and prone to whipsaws.

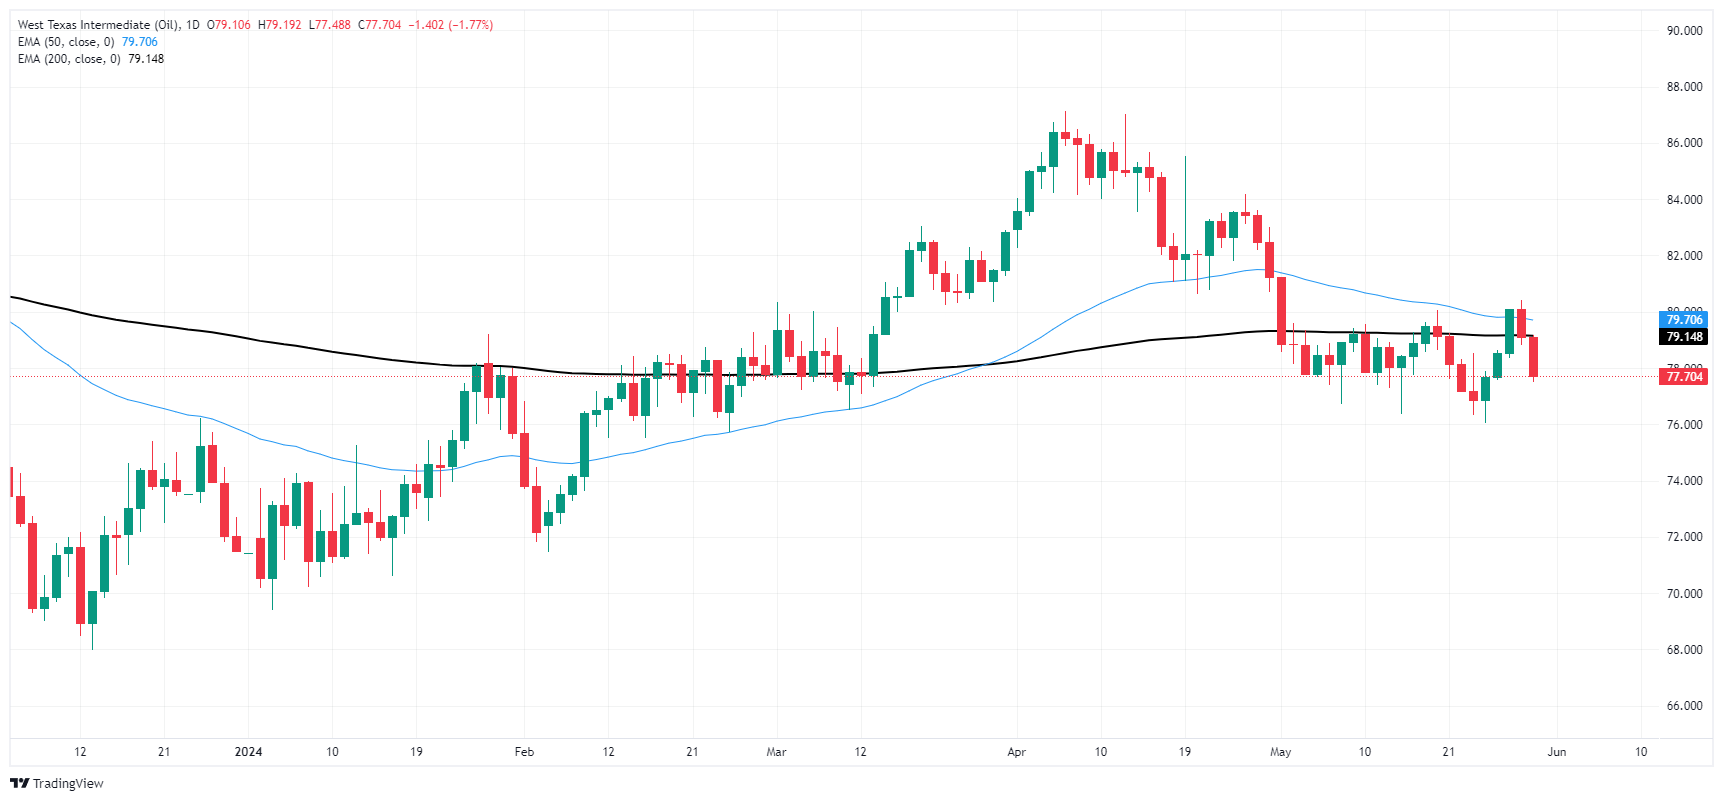
Thursday’s decline drags WTI firmly south of the 200-day Exponential Moving Average (EMA) at $79.15. A recent consolidation pattern is firming up between the 200-day EMA and recent swing lows below $77.00 per barrel.

WTI hourly chart
WTI daily chart
WTI US OIL

Overview
Today last price 77.7
Today Daily Change -1.41
Today Daily Change % -1.78
Today daily open 79.11
 
Trends
Daily SMA20 78.47
Daily SMA50 81.32
Daily SMA100 78.94
Daily SMA200 79.57
 
Levels
Previous Daily High 80.41
Previous Daily Low 78.82
Previous Weekly High 80.06
Previous Weekly Low 76.04
Previous Monthly High 87.12
Previous Monthly Low 80.62
Daily Fibonacci 38.2% 79.43
Daily Fibonacci 61.8% 79.81
Daily Pivot Point S1 78.48
Daily Pivot Point S2 77.86
Daily Pivot Point S3 76.89
Daily Pivot Point R1 80.07
Daily Pivot Point R2 81.04
Daily Pivot Point R3 81.66


Disclaimer: For information purposes only. Past performance is not indicative of future results.
placeholder
Japanese Yen rallies to February 18 high as upbeat wage data and GDP lift BoJ hike betsThe USD/JPY pair declines for the second straight day – also marking the fourth day of a fall in the previous five – and sinks to its lowest level since February 18, around mid-153.00s during the Asian session on Tuesday.
Author  FXStreet
Sep 08, Tue
The USD/JPY pair declines for the second straight day – also marking the fourth day of a fall in the previous five – and sinks to its lowest level since February 18, around mid-153.00s during the Asian session on Tuesday.
placeholder
Gold slumps to near $4,350 amid oil-driven inflation fears, US inflation data in focusGold price (XAU/USD) falls to near $4,350 during the early Asian session on Wednesday. The precious metal faces some selling pressure as rising oil prices fueled inflation ‌concerns and boosted expectations for a rate hike by the Federal Reserve (Fed) in September.
Author  FXStreet
Sep 09, Wed
Gold price (XAU/USD) falls to near $4,350 during the early Asian session on Wednesday. The precious metal faces some selling pressure as rising oil prices fueled inflation ‌concerns and boosted expectations for a rate hike by the Federal Reserve (Fed) in September.
placeholder
Over 140,000 Traders Liquidated as Bitcoin Nears $78,000 in Four-Day Drop, Altcoins Broadly SlumpOver 140,000 traders liquidated in crypto market as BTC drops for fourth straight day to test $78,000 level; altcoins crash.On September 10, the cryptocurrency market experienced a new ro
Author  TradingKey
Yesterday 01: 39
Over 140,000 traders liquidated in crypto market as BTC drops for fourth straight day to test $78,000 level; altcoins crash.On September 10, the cryptocurrency market experienced a new ro
placeholder
Brent holds above $100 as tanker attacks tighten supply — but four forces are capping the rallyBrent crude is holding above $100 a barrel for a second session, its first close above the level since late July, as tanker attacks near the Strait of Hormuz squeeze an already tight physical market. Yet the rally has been gradual: 8.3 mb/d of Gulf output is still shut in, diesel is at a record, and forecasts now range from $74 to $100.
Author  Irene Q.
Yesterday 07: 34
Brent crude is holding above $100 a barrel for a second session, its first close above the level since late July, as tanker attacks near the Strait of Hormuz squeeze an already tight physical market. Yet the rally has been gradual: 8.3 mb/d of Gulf output is still shut in, diesel is at a record, and forecasts now range from $74 to $100.
placeholder
US August CPI lands tonight: after a 5.4% PPI shock, will the Fed hike on September 16?US August PPI came in at 5.4% year-on-year, above the 5.3% consensus, with core PPI at 4.6%. Traders have pushed the odds of a 25bp Fed hike on September 15-16 to around 70%. Tonight's CPI is the last major inflation print before the decision — here is the full calendar, the consensus numbers, and what a hot versus cool reading would mean for the dollar, yields, gold and stocks.
Author  Irene Q.
3 hours ago
US August PPI came in at 5.4% year-on-year, above the 5.3% consensus, with core PPI at 4.6%. Traders have pushed the odds of a 25bp Fed hike on September 15-16 to around 70%. Tonight's CPI is the last major inflation print before the decision — here is the full calendar, the consensus numbers, and what a hot versus cool reading would mean for the dollar, yields, gold and stocks.
goTop
quote