Silver Price Forecast: XAG/USD takes support near $31, uncertainty is intact ahead of US Inflation

Source Fxstreet
  • Silver price finds interim support near $31.00 as US Dollar corrects further.
  • The US Dollar comes under pressure after revised estimate for Q1 US GDP showed that the economy grew at a slower pace of 1.3%.
  • Silver price could fall on backfoot if it breaks below the psychological support of $30.00.

Silver price (XAG/USD) finds a temporary support near $31.20 in Thursday’s American session after correcting from a weekly high of $32.30. The white metal discovers support after the US Dollar declines further after the United States (US) Department of Labor reported that individuals claiming jobless benefits for the first time for the week ending May 24 were higher at 219K from the estimates of 218K and the former reading of 216K.

Separately, the outcome of a slower US growth rate in the first quarter of the year in the second estimate against preliminary readings has also weighed on the US Dollar. The second estimate for the Q1 real GDP shows that the economy expanded at a slower pace of 1.3% from 1.6% growth recorded in advance estimates.

The US Dollar Index (DXY) has corrected further to 104.76. A downside move in the US Dollar is favorable for dollar-denominated assets such as Silver.

Meanwhile, the uncertainty over the near-term outlook of the Silver price remains intact ahead of the United States core Personal Consumption Expenditure Price Index (PCE) data for April, which will be published on Friday. Annual and monthly core PCE inflation readings are estimated to have grown steadily by 2.8% and 0.3% respectively.

The Federal Reserve’s (Fed) preferred inflation gauge will significantly influence speculation for Fed rate cuts in September. Currently, financial markets expect that the Fed will start reducing interest rates from the last quarter of the year.

Silver technical analysis

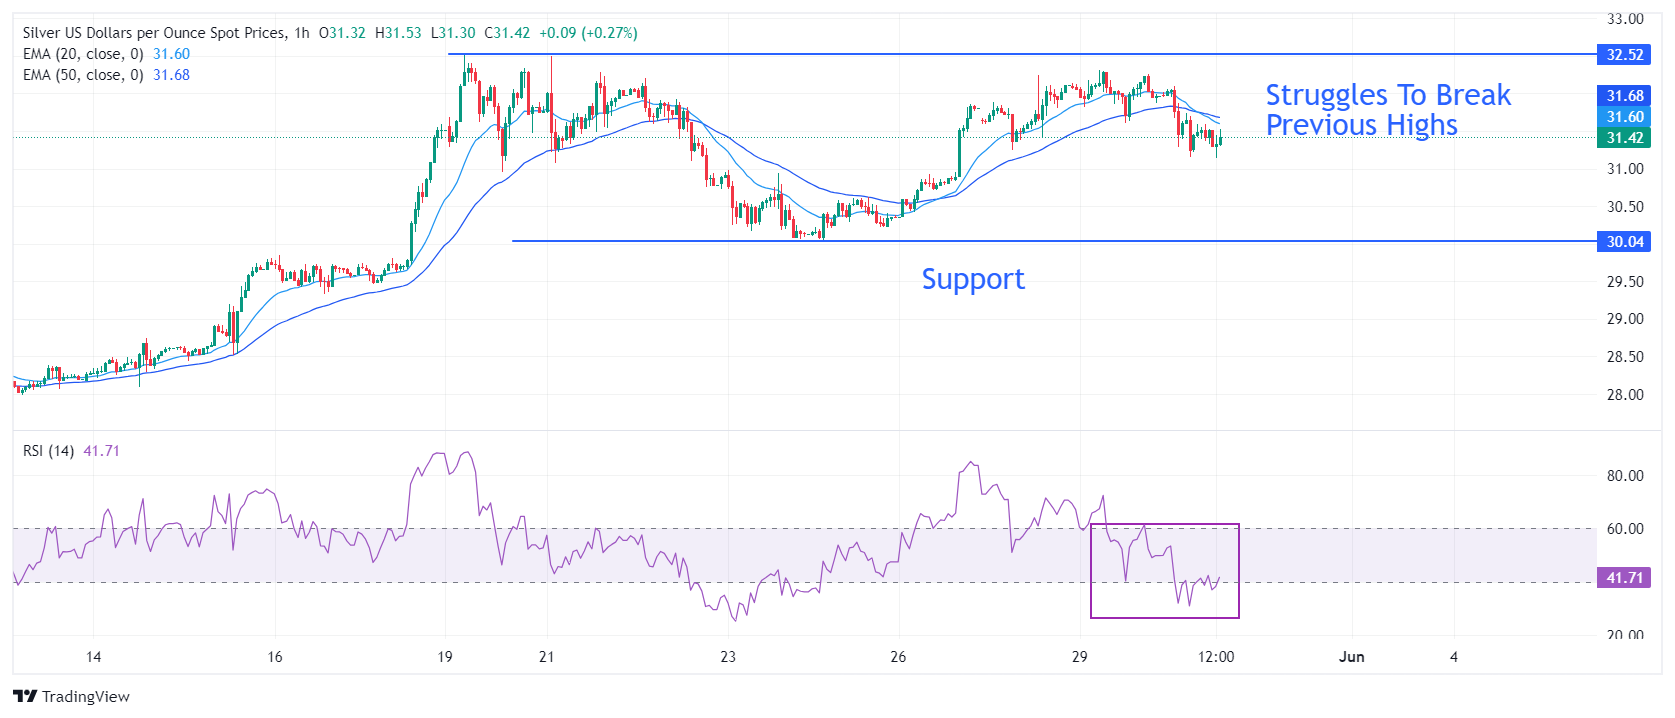
Silver price faces selling pressure while attempting to break previous highs of $32.50. The outlook of the white metal is uncertain as the 20- and 50-period Exponential Moving Averages (EMAs) have delivered a bearish crossover near $31.75.

The 14-period Relative Strength Index (RSI) has shifted into the 20.00-60.00 range from the bullish range of 40.00-80.00.

A breakdown below the horizontal support marked from May 23 low around $30.00 would result in a bearish reversal.

Silver hourly chart

XAG/USD

Overview
Today last price 31.48
Today Daily Change -0.49
Today Daily Change % -1.53
Today daily open 31.97
 
Trends
Daily SMA20 29.51
Daily SMA50 27.91
Daily SMA100 25.54
Daily SMA200 24.42
 
Levels
Previous Daily High 32.3
Previous Daily Low 31.6
Previous Weekly High 32.51
Previous Weekly Low 30.05
Previous Monthly High 29.8
Previous Monthly Low 24.75
Daily Fibonacci 38.2% 31.87
Daily Fibonacci 61.8% 32.04
Daily Pivot Point S1 31.62
Daily Pivot Point S2 31.26
Daily Pivot Point S3 30.92
Daily Pivot Point R1 32.32
Daily Pivot Point R2 32.66
Daily Pivot Point R3 33.02


Disclaimer: For information purposes only. Past performance is not indicative of future results.
placeholder
Nvidia Q1 Revenue Surges 85%, Data Center Business Accounts for 90%, Blowout Results Fail to Stop Stock VolatilityAs the absolute leader in the global AI industry chain, NVIDIA ( NVDA) delivered a quarterly earnings report that surpassed Wall Street's general expectations as anticipated.After the mar
Author  TradingKey
7 hours ago
As the absolute leader in the global AI industry chain, NVIDIA ( NVDA) delivered a quarterly earnings report that surpassed Wall Street's general expectations as anticipated.After the mar
placeholder
Is US-Iran Conflict About to End? Crude Oil Plummets, Gold Hits $4,500Tensions between the US and Iran showed clear signs of easing on Wednesday (May 20), leading to a plunge in the crude oil market while gold ( XAUUSD) continued its rally.WTI crude oil dai
Author  TradingKey
11 hours ago
Tensions between the US and Iran showed clear signs of easing on Wednesday (May 20), leading to a plunge in the crude oil market while gold ( XAUUSD) continued its rally.WTI crude oil dai
placeholder
Gold holds steady near $4,550 as market eyes Middle East developmentsGold price (XAU/USD) trades on a flat note around $4,540 during the early Asian session on Thursday. Traders continue to assess the developments surrounding stalled US-Iran peace negotiations and threats to the Strait of Hormuz.
Author  FXStreet
15 hours ago
Gold price (XAU/USD) trades on a flat note around $4,540 during the early Asian session on Thursday. Traders continue to assess the developments surrounding stalled US-Iran peace negotiations and threats to the Strait of Hormuz.
placeholder
Nvidia Earnings Approach: Can It Drive a Nasdaq Rebound? What Should Investors Watch Most?On May 20, ET, NVIDIA ( NVDA )'s first-quarter fiscal 2026 earnings report, to be released after the market close, has become the market focus. The options market has already reacted; bas
Author  TradingKey
Yesterday 10: 33
On May 20, ET, NVIDIA ( NVDA )'s first-quarter fiscal 2026 earnings report, to be released after the market close, has become the market focus. The options market has already reacted; bas
placeholder
Gold Prices Fall Below Key $4,500 Mark, US Treasury Yields Rise for Seventh Day, Gold May Fall to $4,100On Tuesday (May 19), gold ( XAUUSD) closed at $4,481.89. The price confirmed a break below $4,500, further opening up the downside. On Wednesday, gold extended its downward trend from the
Author  TradingKey
Yesterday 03: 34
On Tuesday (May 19), gold ( XAUUSD) closed at $4,481.89. The price confirmed a break below $4,500, further opening up the downside. On Wednesday, gold extended its downward trend from the
Related Instrument
goTop
quote