

Gold declines on higher interest-rate expectations
- Gold price falls as interest rates are expected to remain high, increasing the opportunity cost of holding Gold.
- Fed speakers continue calling for a delay in lowering interest rates, Eurozone inflation is probably rising.
- Gold breaks out of its Bear Flag pattern and starts declining towards its bearish targets.
Gold (XAU/USD) edges lower into the $2,330s on Thursday and finds support at the 50-day Simple Moving Average (SMA). Gold’s decline continues to be driven by higher global interest-rate expectations, which raise the opportunity cost of holding the non-yielding precious metal.
Gold pressured as interest rates to remain elevated
Gold has resumed its short-term bearish bias after a few days of backing and filling. The main drivers appear to be Federal Reserve (Fed) commentaries suggesting that US interest rates are set to remain high, and higher-than-expected inflation readings in Europe.
Minneapolis Fed President Neel Kashkari surprised markets on Tuesday when he said Fed officials had not disregarded hiking interest rates. He then added that if the Fed did cut borrowing costs, it would be twice toward the end of 2024.
Meanwhile, German and Spanish inflation data showed higher-than-expected readings in Europe, which reduces the probability that the European Central Bank (ECB) will follow their widely publicized June interest rate cut with a string of further cuts.
The preliminary Harmonized Index of Consumer Prices (HICP) in Germany rose by 2.8% year-over-year in May, beating economists’ expectations of 2.7% and the previous 2.4% reading, data from Eurostat showed on Wednesday.
According to data released on Thursday, the preliminary HICP in Spain rose by 3.8% in May, beating the 3.7% forecast and well above the 3.4% of the previous month.
The German and Spanish data suggest that Eurozone-wide HICP will also show an above-consensus reading when released on Friday. This could prompt the ECB to put the breaks on lowering interest rates in order to manage persistent inflationary pressures.
Technical Analysis: Gold breaks out of Bear Flag
Gold price has broken out of a rectangular formation (red-shaded area in the chart below), which is probably a Bear Flag continuation price pattern formed between May 24 and 27.
Bear Flags look like upside-down flags composed of a sharp decline – the flagpole – and the consolidation phase or flag square.
XAU/USD 4-hour Chart
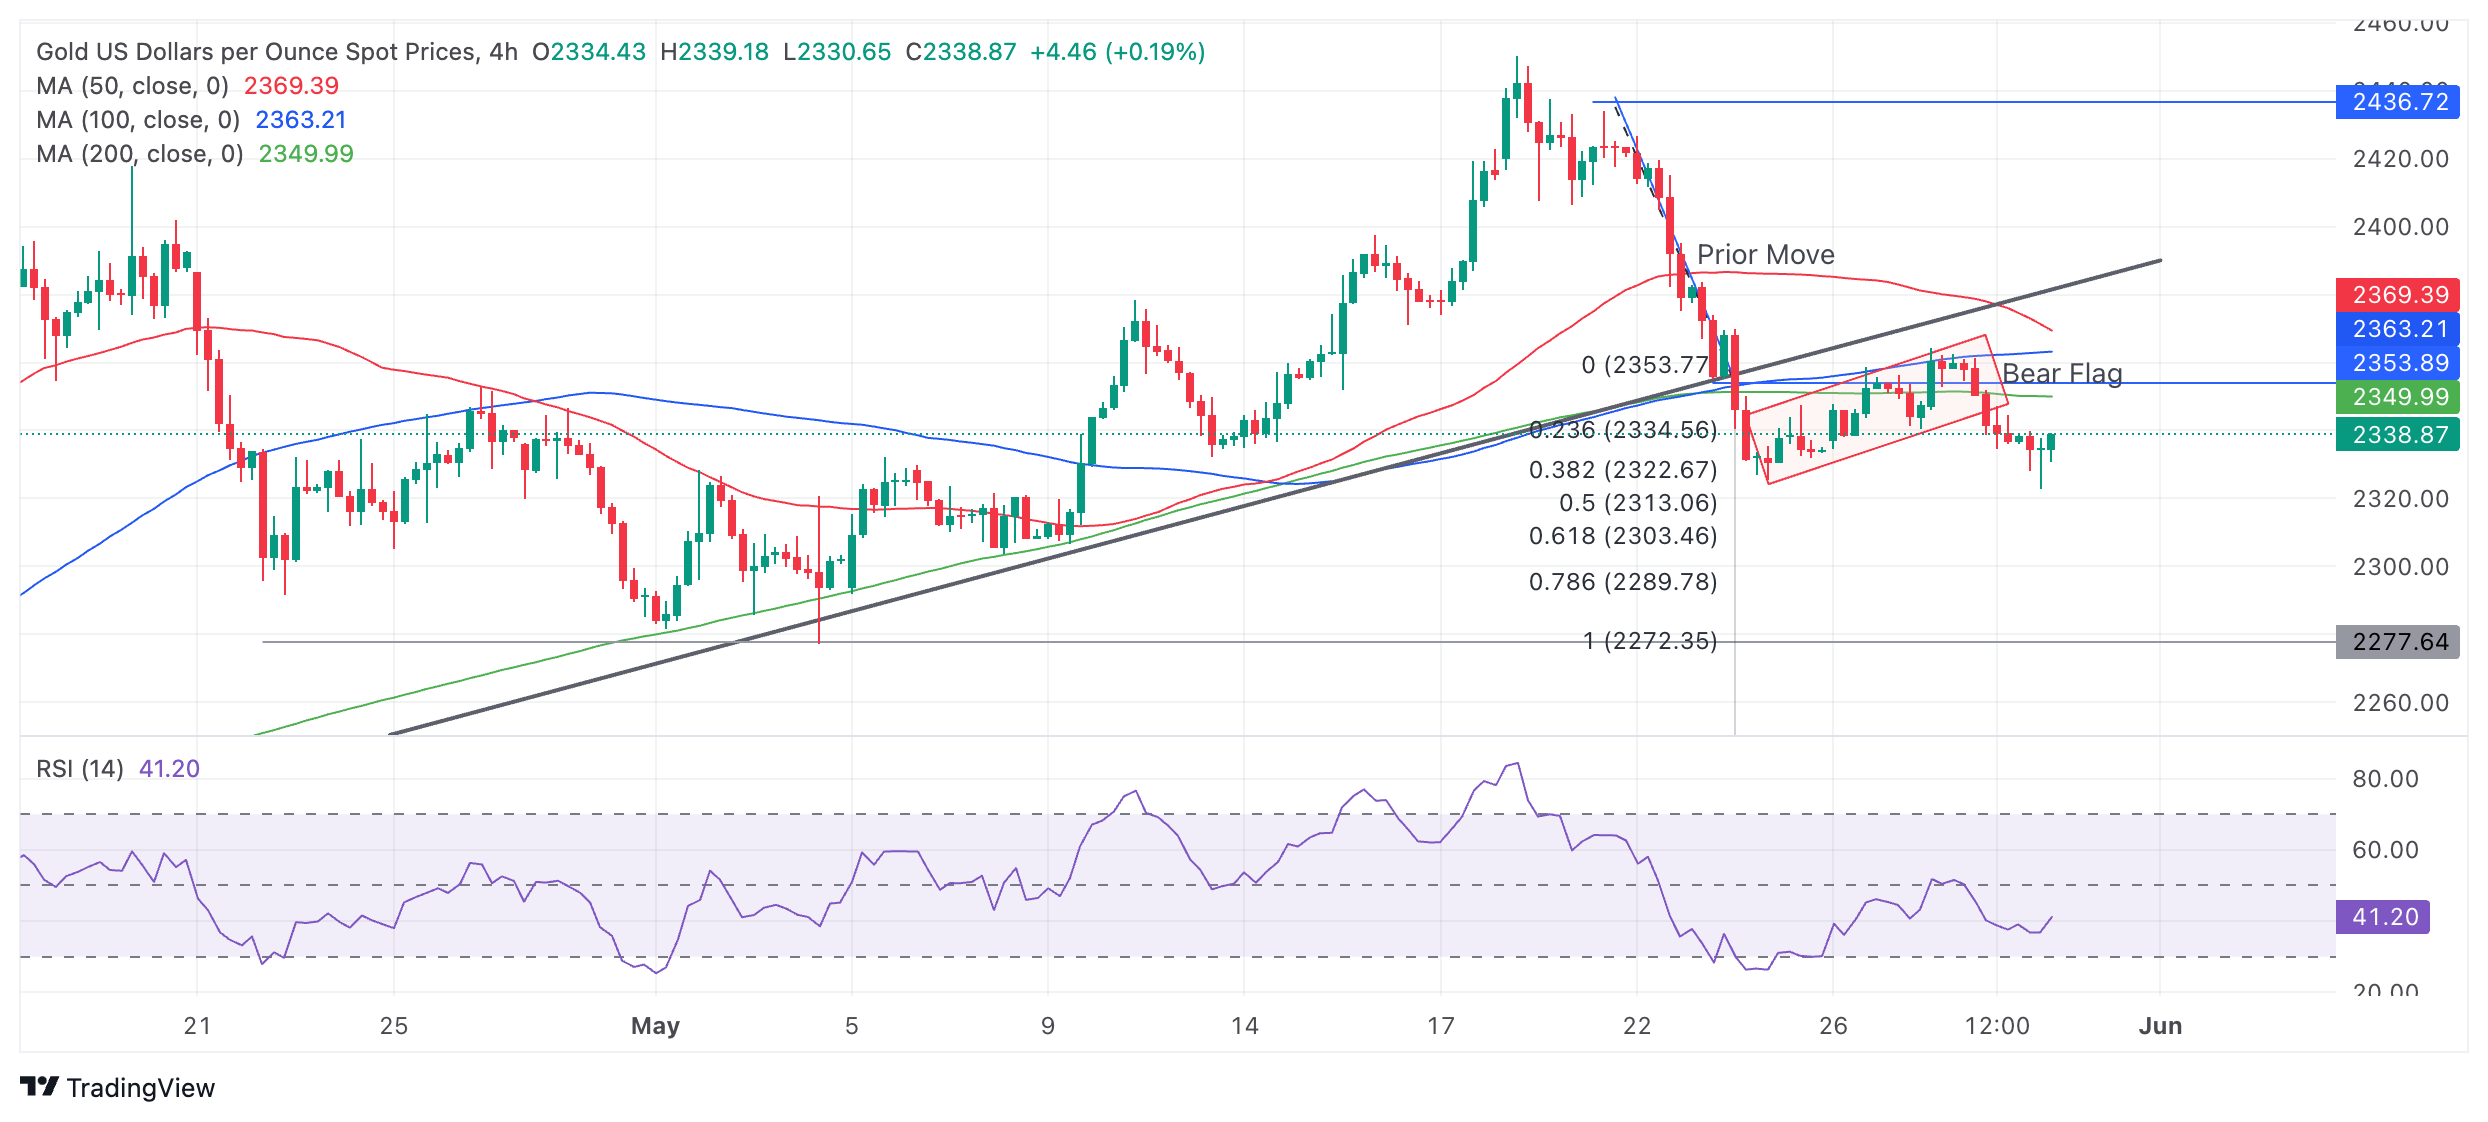
The breakout from the Bear Flag continuation pattern suggests a substantial downside to a target zone between $2,303 and $2,295. A break below Thursday’s $2,322 lows would provide bearish confirmation.
Last week’s decisive break below the major trend line provides the first target at $2,303 (the Fibonacci 0.618 extrapolation of the down move prior to the break). The second target is the 0.618 Fibonacci extension of the flagpole (move down between May 21 and 24).
A more bearish move could see Gold fall to $2,272 (the 100% extrapolation of the move prior to the trend-line break).
Gold's 4-hour chart, used to assess the short-term trend, exhibits a sequence of declining peaks and troughs. It is likely to be in a short-term downtrend now, favoring short positions over longs.
The precious metal’s medium and long-term trends are still bullish, however, suggesting the risk of a recovery remains high, yet price action is not supporting a resumption hypothesis at the moment.
A decisive break back above the trendline, now at around $2,385, would be required to provide evidence of a recovery and reversal of the short-term downtrend.
A decisive break would be one accompanied by a long green bullish candle or three green candles in a row.
Gold FAQs
Gold has played a key role in human’s history as it has been widely used as a store of value and medium of exchange. Currently, apart from its shine and usage for jewelry, the precious metal is widely seen as a safe-haven asset, meaning that it is considered a good investment during turbulent times. Gold is also widely seen as a hedge against inflation and against depreciating currencies as it doesn’t rely on any specific issuer or government.
Central banks are the biggest Gold holders. In their aim to support their currencies in turbulent times, central banks tend to diversify their reserves and buy Gold to improve the perceived strength of the economy and the currency. High Gold reserves can be a source of trust for a country’s solvency. Central banks added 1,136 tonnes of Gold worth around $70 billion to their reserves in 2022, according to data from the World Gold Council. This is the highest yearly purchase since records began. Central banks from emerging economies such as China, India and Turkey are quickly increasing their Gold reserves.
Gold has an inverse correlation with the US Dollar and US Treasuries, which are both major reserve and safe-haven assets. When the Dollar depreciates, Gold tends to rise, enabling investors and central banks to diversify their assets in turbulent times. Gold is also inversely correlated with risk assets. A rally in the stock market tends to weaken Gold price, while sell-offs in riskier markets tend to favor the precious metal.
The price can move due to a wide range of factors. Geopolitical instability or fears of a deep recession can quickly make Gold price escalate due to its safe-haven status. As a yield-less asset, Gold tends to rise with lower interest rates, while higher cost of money usually weighs down on the yellow metal. Still, most moves depend on how the US Dollar (USD) behaves as the asset is priced in dollars (XAU/USD). A strong Dollar tends to keep the price of Gold controlled, whereas a weaker Dollar is likely to push Gold prices up.
Recommended Articles


