

Oil sinks back below $80 as bond market sell-off rattles markets
- Oil sinks back below $80, snapping technical support.
- Sluggish demand comes back into play as increasing bond yields risk Fed delaying the initial rate cut.
- The US Dollar Index edged up to 105.00 as the rate differential widens in favor of the Greenback.
Oil prices are retreating further on Thursday after bond traders on Wednesday took all asset classes for a rough ride. This week, the US bond market has seen quite a few big bond allocations, with bond traders starting to demand higher yields. This resurgence drove the rate differential wider between the US Dollar (USD) against other currencies and sent equities nosediving across the globe.
Meanwhile, the US Dollar Index (DXY) jumped higher on the back of this dynamic, which shows how correlated asset classes can be in specific scenarios. However, traders are on edge for some US data, namely the US Gross Domestic Product on Thursday and the Personal Consumption Expenditures (PCE) Price Index print on Friday. Both elements have the potential to be market-moving as volatility is picking up.
At the time of writing, Crude Oil (WTI) trades at $78.73 and Brent Crude at $83.03
Oil news and market movers: Aramco offers discounts
- Saudi Aramco might be set to reduce its official selling price by 40 cents per barrel for July sales to Asia, according to a Bloomberg survey.
- Bloomberg Intelligence Economist Ziad Daoud reports that more downside might be seen in Oil prices with US markets seeing ample supply while demand is weakening and war risks in both the Middle East and Ukraine are starting to fade.
- ConocoPhillips announced on Wednesday that it had agreed to buy Marathon Oil in a deal worth $22.5 billion, Reuters reports.
- Several traders and banks are reporting risk for more downturn should markets start to price out any rate cuts from the US Federal Reserve for 2024. A pickup in Oil demand is not foreseen until at least the first quarter of 2025, Reuters reports.
- The Energy Information Administration (EIA) will release its weekly Crude Stockpile Change numbers for this week on Thursday. The previous number was a build of 1.825 million barrels, and a drawdown of 1.9 million barrels is expected for this week.
Oil Technical Analysis: Recovery erased
Oil prices are sensitive, to say the least. The recent recovery was built on assumptions that interest rates are easing and that the Fed would cut at least once this year, achieving a soft landing for the US economy and holding up Oil demand.None of those assumptions look valid after the bond massacre on Wednesday, when bond traders said they had enough of all these US debt issuances and demanded more yield before buying. With doubts about an initial cut for 2024, markets are fearing that customers will not be able to consume and spend as much as they are doing now, which means that demand for Oil will decline. This leads to a lower repricing under these conditions.
First, the Simple Moving Averages (SMA) need to be regained under control. The 100-day SMA at $79.01 and the 200-day SMA at $79.57 are the first levels on the upside. Next, the 55-day Simple Moving Average (SMA) at $81.27 and the descending trendline at $81.75 are an area with a lot of resistance where any recovery rally could pause. Once broken through there, the road looks quite open to head to $87.12.
On the downside, the $76.00 marker is coming back into focus with the $75.27 level playing a crucial role if traders still want to have an option to head back to $80.00. Should that $75.27 pivotal level snap, expect to see a risk-full nosedive move that could sprint all the way down to $68, below $70.00.
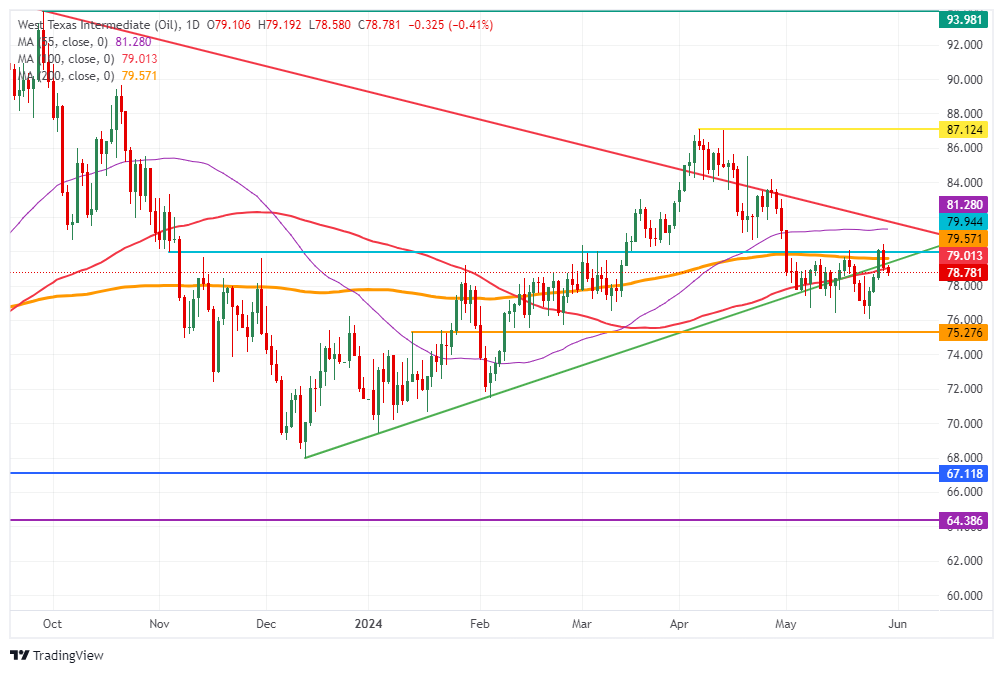
US WTI Crude Oil: Daily Chart
WTI Oil FAQs
WTI Oil is a type of Crude Oil sold on international markets. The WTI stands for West Texas Intermediate, one of three major types including Brent and Dubai Crude. WTI is also referred to as “light” and “sweet” because of its relatively low gravity and sulfur content respectively. It is considered a high quality Oil that is easily refined. It is sourced in the United States and distributed via the Cushing hub, which is considered “The Pipeline Crossroads of the World”. It is a benchmark for the Oil market and WTI price is frequently quoted in the media.
Like all assets, supply and demand are the key drivers of WTI Oil price. As such, global growth can be a driver of increased demand and vice versa for weak global growth. Political instability, wars, and sanctions can disrupt supply and impact prices. The decisions of OPEC, a group of major Oil-producing countries, is another key driver of price. The value of the US Dollar influences the price of WTI Crude Oil, since Oil is predominantly traded in US Dollars, thus a weaker US Dollar can make Oil more affordable and vice versa.
The weekly Oil inventory reports published by the American Petroleum Institute (API) and the Energy Information Agency (EIA) impact the price of WTI Oil. Changes in inventories reflect fluctuating supply and demand. If the data shows a drop in inventories it can indicate increased demand, pushing up Oil price. Higher inventories can reflect increased supply, pushing down prices. API’s report is published every Tuesday and EIA’s the day after. Their results are usually similar, falling within 1% of each other 75% of the time. The EIA data is considered more reliable, since it is a government agency.
OPEC (Organization of the Petroleum Exporting Countries) is a group of 13 Oil-producing nations who collectively decide production quotas for member countries at twice-yearly meetings. Their decisions often impact WTI Oil prices. When OPEC decides to lower quotas, it can tighten supply, pushing up Oil prices. When OPEC increases production, it has the opposite effect. OPEC refers to an expanded group that includes ten extra non-OPEC members, the most notable of which is Russia.
Recommended Articles


