Silver Price Analysis: XAG/USD tumbles below $32.00 as ‘double top’ looms

Source Fxstreet
  • Silver prices dropped on Wednesday, closing the session at $31.97.
  • Price action suggests ‘double top’ looming, yet pending validation.
  • Watch key levels: $31.00 psychological support, May 24 high at $30.61, and $30.00 for pattern confirmation.

Silver prices posted modest losses of 0.32% on Wednesday as US Treasury bond yields edged up, downward pressure on precious metals. Therefore, the XAG/USD retreated after hitting a six-day high of $32.29, and as the Asian session began, it traded at $31.97, almost flat.

XAG/USD Price Analysis: Technical outlook

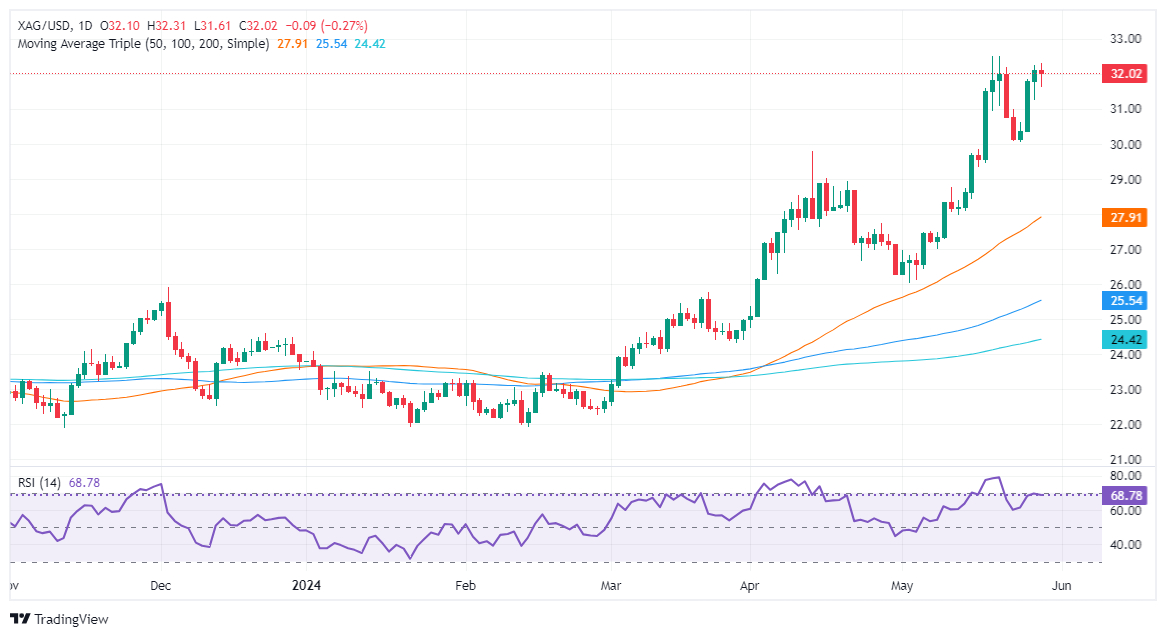
Silver is upward based, but a ‘double top’ chart pattern seems to be forming on the daily chart. Momentum supports buyers, yet they’re losing steam as the Relative Strength Index (RSI) is flat near overbought conditions.

For confirmation of a ‘double top,’ the grey metal needs to drop below $30.00 a troy ounce. Nevertheless, on its way there, the XAG/USD needs to clear the $31.00 psychological level, followed by the May 24 high of $30.61, ahead of the $30.00 mark.

If XAG/USD buyers reclaim $32.00, that could pave the way to re-test the year-to-date (YTD) high of $32.51.

XAG/USD Price Action – Daily Chart

XAG/USD

Overview
Today last price 31.98
Today Daily Change -0.12
Today Daily Change % -0.37
Today daily open 32.1
 
Trends
Daily SMA20 29.25
Daily SMA50 27.77
Daily SMA100 25.45
Daily SMA200 24.38
 
Levels
Previous Daily High 32.25
Previous Daily Low 31.24
Previous Weekly High 32.51
Previous Weekly Low 30.05
Previous Monthly High 29.8
Previous Monthly Low 24.75
Daily Fibonacci 38.2% 31.86
Daily Fibonacci 61.8% 31.63
Daily Pivot Point S1 31.48
Daily Pivot Point S2 30.86
Daily Pivot Point S3 30.48
Daily Pivot Point R1 32.49
Daily Pivot Point R2 32.87
Daily Pivot Point R3 33.49


Disclaimer: For information purposes only. Past performance is not indicative of future results.
placeholder
USD/CAD Price Forecast: Eyes fresh six-month highs near 1.4150 within overbought zoneThe technical analysis of the daily chart indicates a prevailing bullish bias, with the pair remaining within the ascending channel pattern.
Author  FXStreet
Yesterday 10: 04
The technical analysis of the daily chart indicates a prevailing bullish bias, with the pair remaining within the ascending channel pattern.
placeholder
Dow Jones futures gain amid easing US-China tensions, Michigan Consumer Sentiment awaitedDow Jones futures advance 0.20% to trade above 47,100 during European hours ahead of the opening of the United States (US) regular session on Friday.
Author  FXStreet
Yesterday 10: 01
Dow Jones futures advance 0.20% to trade above 47,100 during European hours ahead of the opening of the United States (US) regular session on Friday.
placeholder
Gold draws support from safe-haven flows and Fed rate cut betsGold catches fresh bids on the last day of the week amid reviving safe-haven demand.
Author  FXStreet
Yesterday 07: 11
Gold catches fresh bids on the last day of the week amid reviving safe-haven demand.
placeholder
WTI Price Forecast: Trades with modest gains below $60.00; not out of the woods yetFrom a technical perspective, the black liquid has been trending lower along a downward-sloping channel since late October.
Author  FXStreet
Yesterday 06: 41
From a technical perspective, the black liquid has been trending lower along a downward-sloping channel since late October.
placeholder
GBP/USD edges lower to near 1.3100 on potential for further BoE rate cutsThe pair depreciates as the Pound Sterling (GBP) weakens following the Bank of England’s (BoE) dovish hold in November.
Author  FXStreet
Yesterday 06: 06
The pair depreciates as the Pound Sterling (GBP) weakens following the Bank of England’s (BoE) dovish hold in November.
Related Instrument
goTop
quote