Silver Price Analysis: XAG/USD trims losses, remains bullish and clings above $30.00

Source Fxstreet
  • Silver climbs 0.59%, trading at $30.30, recovering from near-weekly lows of $30.00.
  • Softer-than-expected US Durable Goods data and improved consumer sentiment support Silver prices.
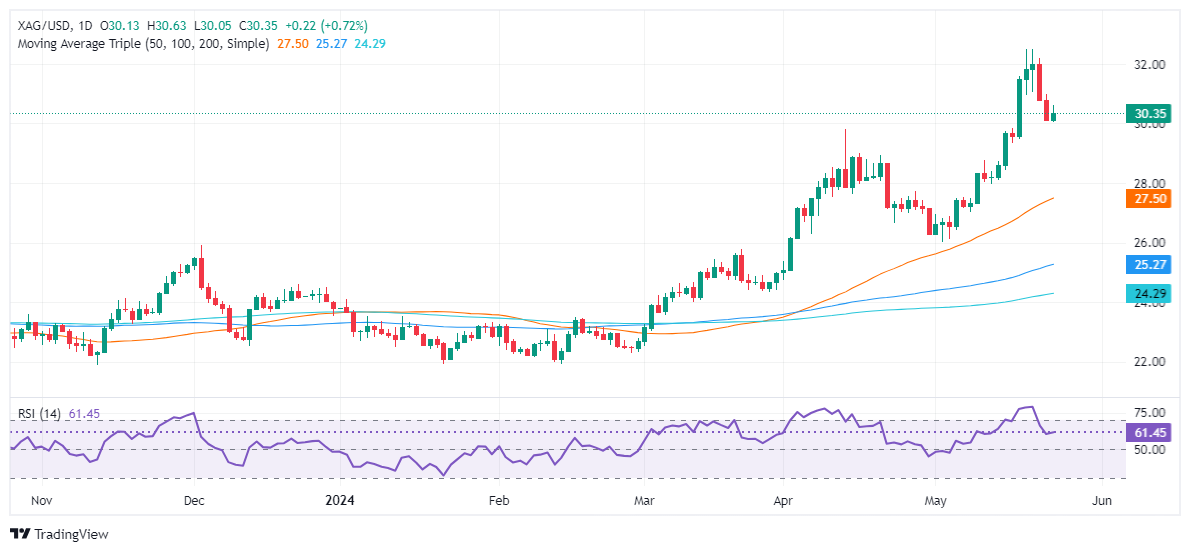
  • RSI remains bullish, indicating strong buyer momentum despite exiting overbought conditions.

Silver prices trimmed some of Thursday’s losses yet remain near the weekly lows of $30.00; exchange hands at $30.30 are up 0.59% at the time of writing. The grey metal was boosted by softer-than-expected US Durable Goods data, while American consumer sentiment improved.

XAG/USD Price Analysis: Technical outlook

The grey metal is upward biased, and the XAG/USD clinging to gains above $30.00 could pave the way for further upside. After the Relative Strength Index (RSI) exited overbought conditions, it remains bullish and aiming up, hinting that the buyer's momentum remains strong.

With that said, the XAG/USD first resistance would be the May 23 high of $30.97. A breach of the latter will expose the $31.50 figure, followed by $32.00, and the year-to-date (YTD) high reached on May 20 at $32.51.

Conversely, XAG/USD's first support would be the $30.00 psychological level. If further weakness occurs, the next support level would be the April 12 high, now turned support, at $29.79, followed by $29.00. Additional key support levels include the May 18, 2021, high at $28.74 and the June 10, 2021, high at $28.28.

XAG/USD Price Action – Daily Chart

XAG/USD

Overview
Today last price 30.36
Today Daily Change 0.23
Today Daily Change % 0.76
Today daily open 30.13
 
Trends
Daily SMA20 28.57
Daily SMA50 27.39
Daily SMA100 25.2
Daily SMA200 24.25
 
Levels
Previous Daily High 30.98
Previous Daily Low 30.07
Previous Weekly High 31.6
Previous Weekly Low 27.97
Previous Monthly High 29.8
Previous Monthly Low 24.75
Daily Fibonacci 38.2% 30.42
Daily Fibonacci 61.8% 30.63
Daily Pivot Point S1 29.8
Daily Pivot Point S2 29.48
Daily Pivot Point S3 28.89
Daily Pivot Point R1 30.72
Daily Pivot Point R2 31.31
Daily Pivot Point R3 31.63


Disclaimer: For information purposes only. Past performance is not indicative of future results.
placeholder
Markets in 2026: Will gold, Bitcoin, and the U.S. dollar make history again? — These are how leading institutions thinkAfter a turbulent 2025, what lies ahead for commodities, forex, and cryptocurrency markets in 2026?
Author  Insights
Dec 25, 2025
After a turbulent 2025, what lies ahead for commodities, forex, and cryptocurrency markets in 2026?
placeholder
ECB Policy Outlook for 2026: What It Could Mean for the Euro’s Next MoveWith the ECB likely holding rates steady at 2.15% and the Fed potentially extending cuts into 2026, EUR/USD may test 1.20 if Eurozone growth proves resilient, but weaker growth and an ECB pivot could pull the pair back toward 1.13 and potentially 1.10.
Author  Mitrade
Dec 26, 2025
With the ECB likely holding rates steady at 2.15% and the Fed potentially extending cuts into 2026, EUR/USD may test 1.20 if Eurozone growth proves resilient, but weaker growth and an ECB pivot could pull the pair back toward 1.13 and potentially 1.10.
placeholder
My Top 5 Stock Market Predictions for 2026Five 2026 market predictions written in a native, news-style voice: AI’s winners and losers, broader sector leadership, dividend demand, valuation cooling as the Shiller CAPE sits at 39 (Dec. 31, 2025), and quantum-computing bursts—while keeping all original facts and numbers unchanged.
Author  Mitrade
Jan 06, Tue
Five 2026 market predictions written in a native, news-style voice: AI’s winners and losers, broader sector leadership, dividend demand, valuation cooling as the Shiller CAPE sits at 39 (Dec. 31, 2025), and quantum-computing bursts—while keeping all original facts and numbers unchanged.
placeholder
Financial Markets 2026: Volatility Catalysts in Gold, Silver, Oil, and Blue-Chip Stocks—A CFD Trader's OutlookGet a comprehensive financial market 2026 outlook exploring key economic drivers, volatility catalysts in gold, oil and stocks, and what the evolving economic outlook means for cfd trading strategies and risk management on global markets.
Author  Rachel Weiss
May 15, Fri
Get a comprehensive financial market 2026 outlook exploring key economic drivers, volatility catalysts in gold, oil and stocks, and what the evolving economic outlook means for cfd trading strategies and risk management on global markets.
placeholder
Gold declines as trading volumes remain subdued due to holidays in ChinaGold price (XAU/USD) extends its losses for the second successive session, trading around $4,930 per troy ounce during the Asian hours on Tuesday.
Author  FXStreet
Feb 17, Tue
Gold price (XAU/USD) extends its losses for the second successive session, trading around $4,930 per troy ounce during the Asian hours on Tuesday.
Related Instrument
goTop
quote