

Crude Oil backslides into the red on Thursday as diminishing rate cut hopes weigh
- WTI falls back below $77 per barrel as investor sentiment sours.
- Broad-market risk appetite evaporates, dragging broader markets lower.
- US production continues to threaten hopes of supply shortage.
West Texas Intermediate (WTI) US Crude Oil slid to fresh lows on Thursday in a risk-off bid sparked by rate cut hopes drying up on the back of fresh concerns that services-side inflation will continue to run hotter than hoped. US Crude Oil production has once again threatened to outpace demand, leading to a fresh buildup in week-on-week barrel counts and renewing concerns that a US-led overhang of Crude Oil could push barrel prices paid even lower.
US Services Purchasing Managers Index (PMI) figures rebounded to a 12-month high in May, printing at 50.9 MoM compared to the forecast steady hold at 50.0. A climbing services activity outlook mixes poorly with a fresh warning from Fitch Ratings on Wednesday that services-side inflation will remain higher for much longer than broadly anticipated. With services activity possibly sparking further services inflation, investors are seeing fresh concerns that interest rates will remain higher for longer, sapping risk appetite on Thursday.
According to the CME’s FedWatch Tool, rate markets are now pricing in roughly equal odds of at least a quarter-point cut in September. This is down sharply from nearly 70% at the beginning of the trading week.
According to the American Petroleum Institute (API) and the Energy Information Administration (EIA), US Crude Oil barrel counts have risen once again week-on-week, eating away at the previous week’s declines. API Crude Oil Stocks for the week ended May 17 rose 2.48 million barrels, well above the forecast -3.1 million drawdown and refilling most of the previous week’s -3.104 million decline. EIA Crude Oil Stocks change also climbed over the same weekly period, adding 1.825 million barrels and snubbing the forecast -3.1 million drawdown. The previous week had seen a -2.508 million barrel decline.
WTI technical outlook
Crude Oil is sharply lower on Thursday, falling into negative territory after reaching an intraday peak with WTI testing $78.50. US Crude Oil has fallen to its lowest bids in over a week, knocking into $76.50 after backsliding through the $77.00 handle.
Thursday’s bearish reversal sends WTI into the red for a fourth consecutive trading day, and US Crude Oil is extending a bearish rejection from the 200-day Exponential Moving Average (EMA) at $79.22.
WTI hourly chart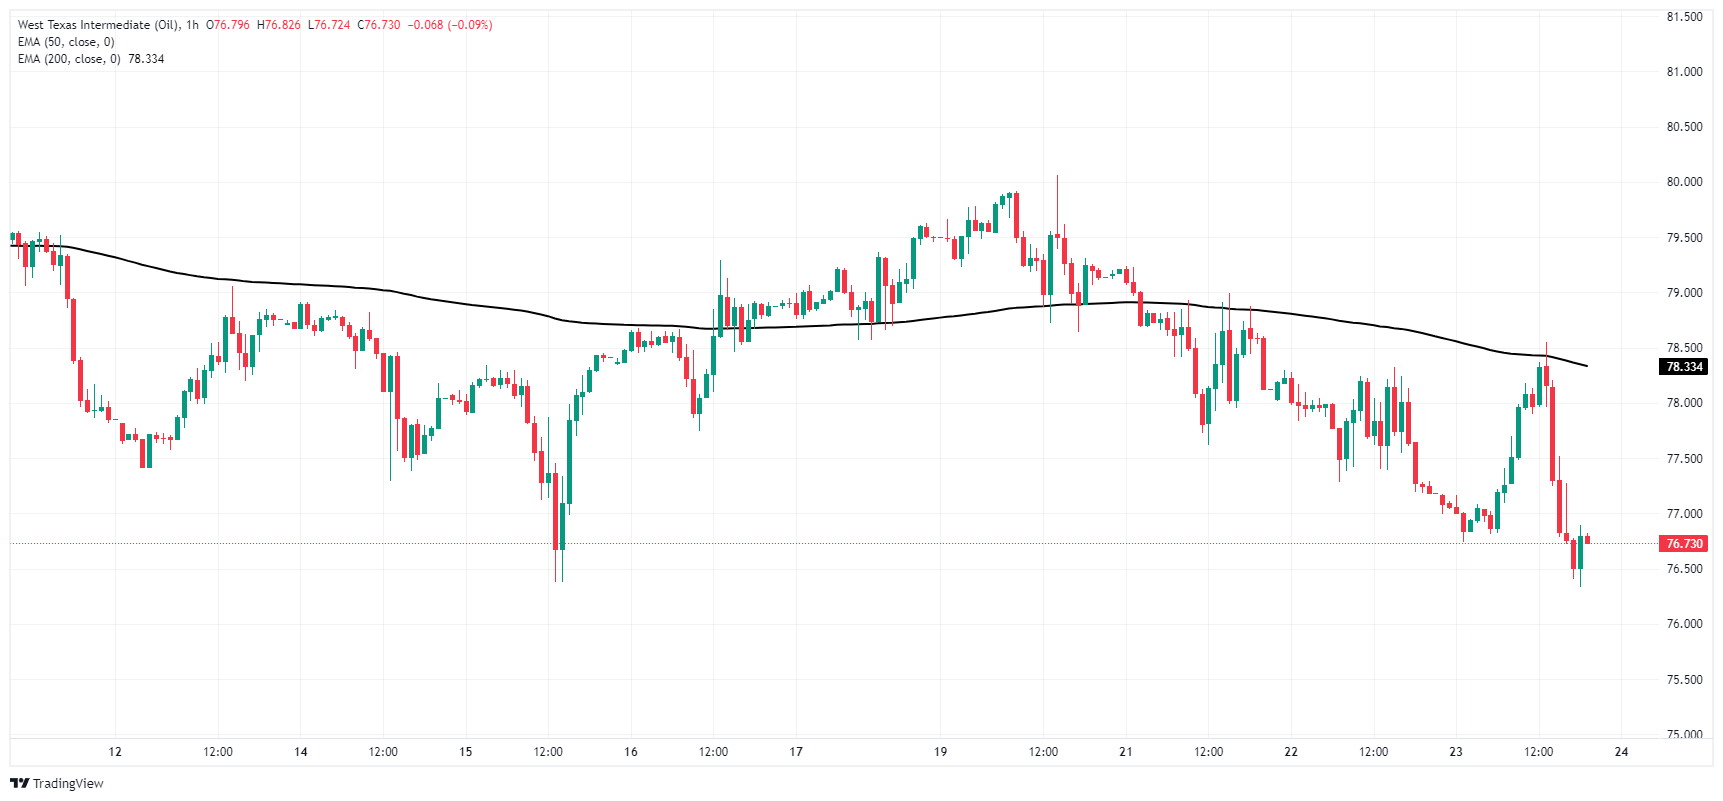
WTI daily chart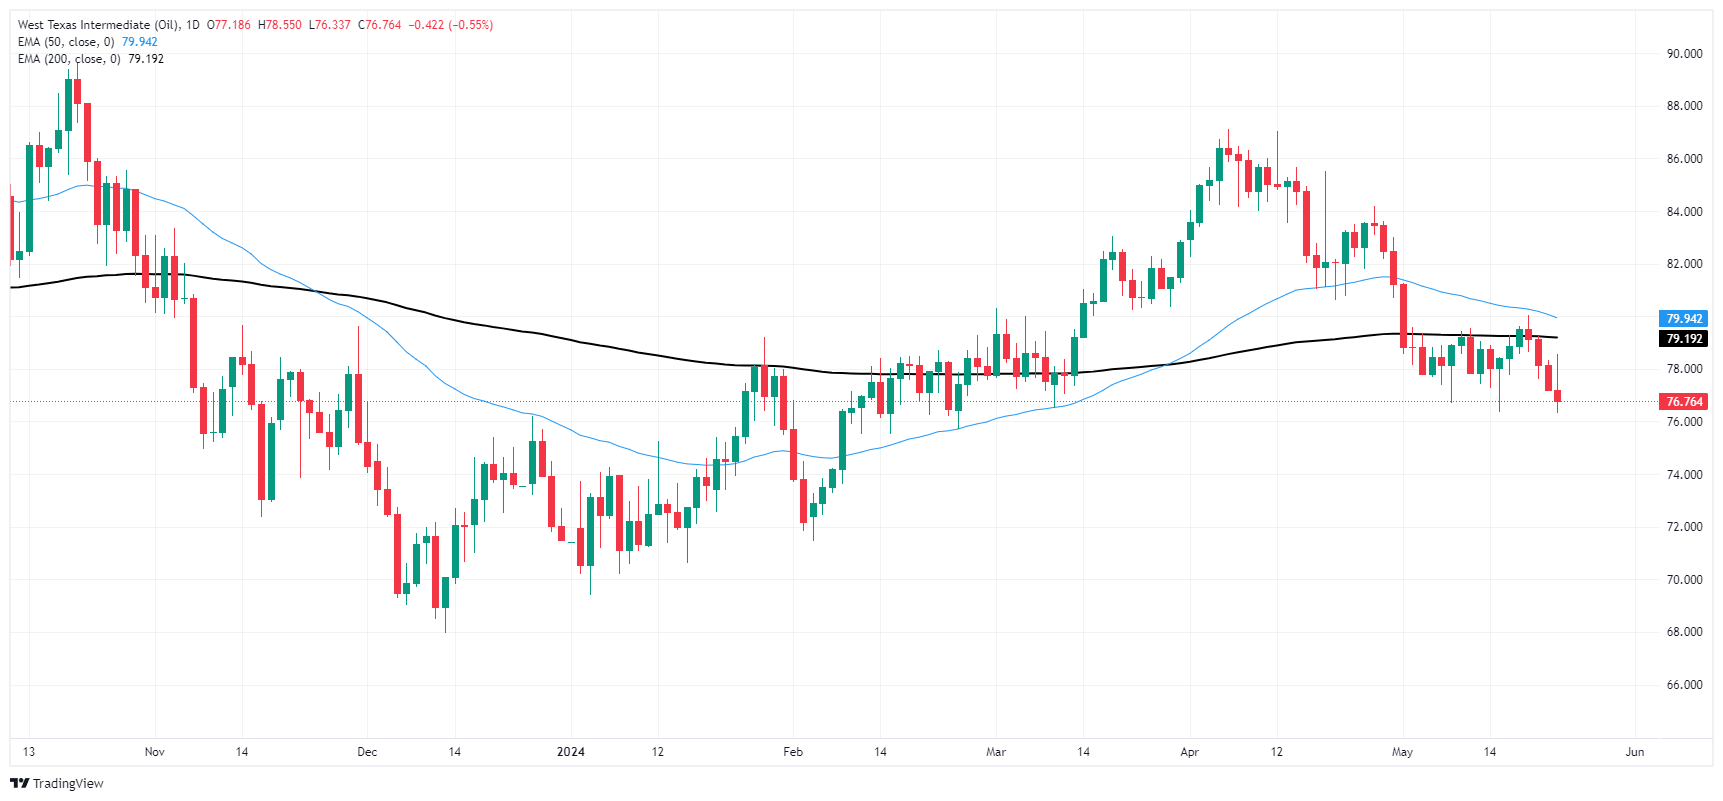
Recommended Articles


