

Natural Gas defies gravity and peaks at $3.00
- Natural Gas prices extend rally on rumors of Russia displacing borders in Baltic Sea.
- Unforeseen Norwegian outage adds to concerns for European refueling.
- The US Dollar Index enters a volatility patch with a bulk release of data points set to this Thursday.
Natural Gas price (XNG/USD) has added another piece to its staggering performance for this year. Since the low of February 24th at $1.6290, gas prices have rallied near 90% to $3.08 on Wednesday. The recent surge comes after Russia communicated that it will redraw borders in the Baltic Sea for its exclave Kaliningrad and around a few Russian Islands near St-Petersburg, heightening tensions for all Baltic and Scandinavian countries in the region with risk that Russia could cut off and control the entrance to the Baltic Sea.
The US Dollar Index (DXY), which tracks the Greenback’s value against six major currencies, is trading higher after markets got spooked by concerns issued by several Federal Reserve members in the release of the Fed Minutes. The DXY had to give up those gains after European, and more specifically Germany’s, Purchase Managers Services Index (PMI) jumped above consensus and further advanced above 50 to 53.9. Later this Thursday US PMI’s are expected together with some regional Fed Activity trackers.
Natural Gas is trading at $3.00 per MMBtu at the time of writing.
Natural Gas news and market movers: Norway disruptions headaches
- Norway has reported that an unplanned outage at its Kollsnes gas processing plant is causing a supply disruption of around 8.6 million cubic meters per day. The duration of the outage is uncertain, Gassco reported.
- A recent court ruling in favor of an undisclosed European energy company ending payments to Gazprom PJSC, might see the last bit of Russian gas flowing into Europe ending. This would mean some issues for Austria, which is still depending on this flow.
- On Wednesday, the Russian Ministry of Defense released papers where it is said to be ready to redraw borders at the Baltic Sea for Kaliningrad and offshore near St-Petersburg. The move caused criticism from all Scandinavian and Baltic countries in the region. With the reshaping of the borders, Russia could try and occupy the Island Gotland, near the Swedish shores and by doing so control all access to the Baltic Sea region.
- The Energy Information Administration (EIA) is set to release the Gas Storage Changes for this week. Last week storage levels were at 70 billion cubic feet, with for this week storages expected to be near 84 billion cubic feet.
Natural Gas Technical Analysis: Take the money and run
Natural Gas is set to become the best performer for this year in terms of returns considering from its lowest level to where it is trading this week. With a very crucial pivotal level ahead, the question now is if it is not the right time to take some profit and re-enter once the pivotal level near $3.07 snaps. Should the recent concerns on the geopolitical front with Russia become reality soon, another 20% could be added towards $3.70 by the end of summer.
The $3.00 marker as a big figure was easily broken on Wednesday. The pivotal level near $3.07 (high of March 6, 2023) is now into play and has marked a new high for 2024 already. Further up, there is room for a quick crossing towards $3.69 should more geopolitical tensions be added.
On the downside, the 200-day Simple Moving Average (SMA) is acting as first support near $2.53. Should that support area fail to hold, then the pivotal level near $2.14 should do the trick ahead of the 55-day and 100-day SMA which both are trading at $2.11.
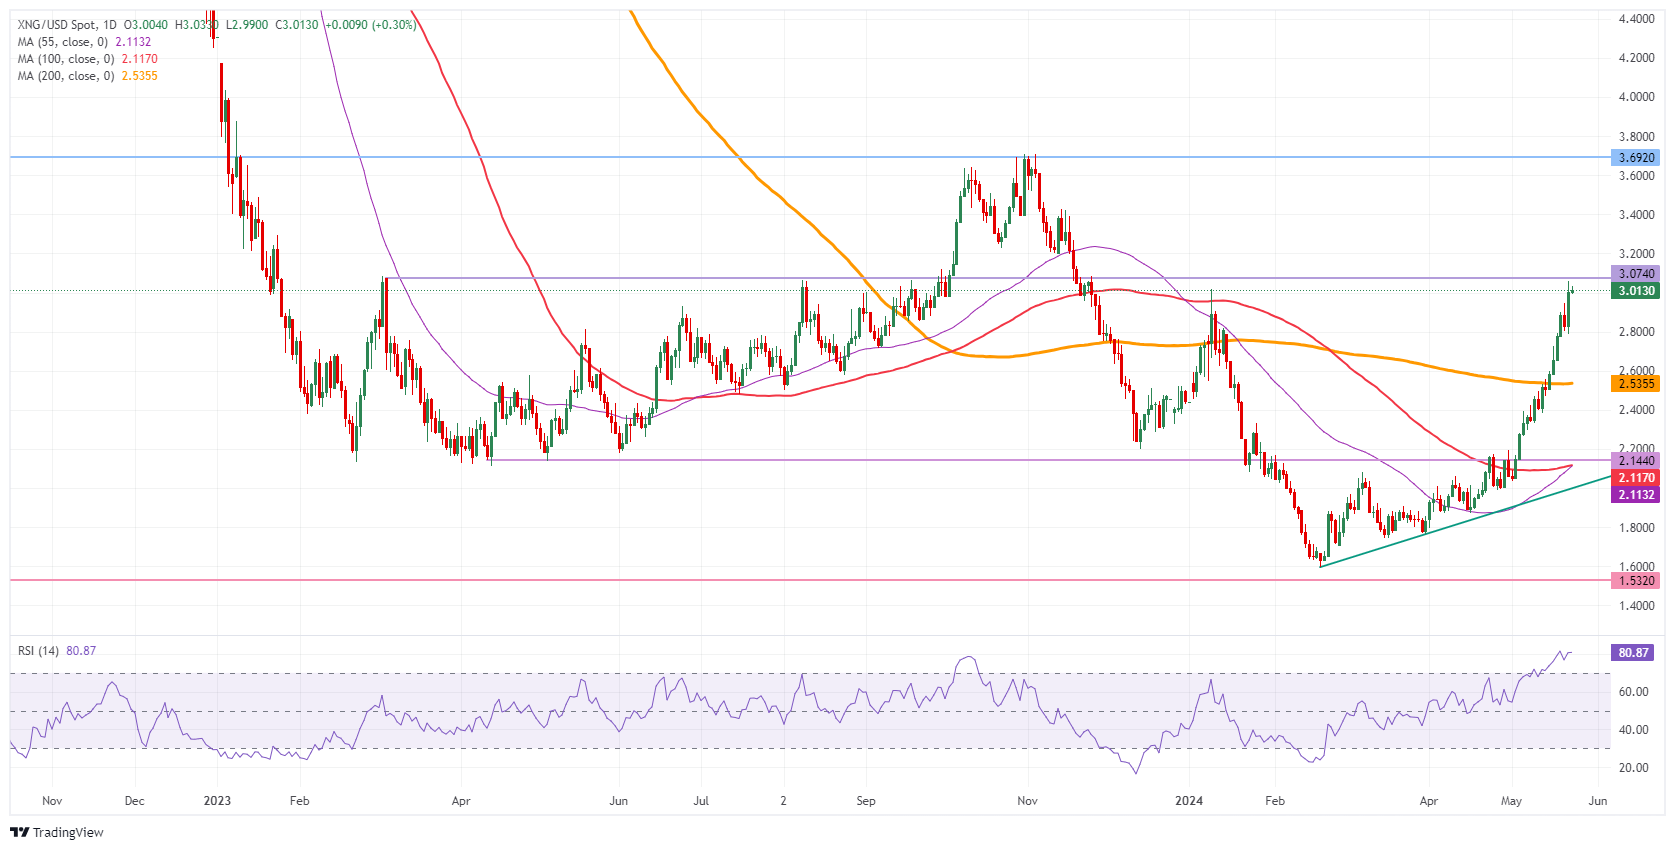
Natural Gas: Daily Chart
Natural Gas FAQs
Supply and demand dynamics are a key factor influencing Natural Gas prices, and are themselves influenced by global economic growth, industrial activity, population growth, production levels, and inventories. The weather impacts Natural Gas prices because more Gas is used during cold winters and hot summers for heating and cooling. Competition from other energy sources impacts prices as consumers may switch to cheaper sources. Geopolitical events are factors as exemplified by the war in Ukraine. Government policies relating to extraction, transportation, and environmental issues also impact prices.
The main economic release influencing Natural Gas prices is the weekly inventory bulletin from the Energy Information Administration (EIA), a US government agency that produces US gas market data. The EIA Gas bulletin usually comes out on Thursday at 14:30 GMT, a day after the EIA publishes its weekly Oil bulletin. Economic data from large consumers of Natural Gas can impact supply and demand, the largest of which include China, Germany and Japan. Natural Gas is primarily priced and traded in US Dollars, thus economic releases impacting the US Dollar are also factors.
The US Dollar is the world’s reserve currency and most commodities, including Natural Gas are priced and traded on international markets in US Dollars. As such, the value of the US Dollar is a factor in the price of Natural Gas, because if the Dollar strengthens it means less Dollars are required to buy the same volume of Gas (the price falls), and vice versa if USD strengthens.
Recommended Articles


